Analysis of Financial Markets based on President Trump's Tweets
13 minute read
![]()
![]() Status: final, Type: Project
Status: final, Type: Project
Alex Baker, fa20-523-307, Edit
Abstract
President Trump has utilized the social media platform Twitter as a way to convey his message to the American people. The tweets he has published during his presidency cover a vast array of topics and issues from MAGA rallies to impeachment. This analysis investigates the relationship of the NASDAQ and the sentiment of President Trump’s tweets during key events in his presidency. NASDAQ data was gathered though Yahoo Finance’s API while President Trump’s tweets were gathered from Kaggle. The results observed show that during certain events, a correlation emerges of the NASDAQ data and the sentiment of President Trump’s tweets.
Contents
Keywords: analysis, finance, stock markets, twitter, politics
1. Introduction
Financial markets have been an area of research in both academia and business. Analysis and predictions has been growing in its accuracy with an every increasing amount of data used to test these models. “The Efficient Market Hypothesis (EMH) states that stock market prices are largely driven by new information and follow a random walk pattern”1. This shows that prices will follow news rather than previous and present prices. Information is unpredictable in terms of its release/publication showing market prices will follow a random walk pattern and the prediction can not be high.
There are some problems that arise with EMH. One problem is that “stock prices does not follow a random walk pattern and can be predicted to a certain degree”2. Another problem associated with EMH is with the information’s unpredictability, the unpredictability is called into question with the introduction of social media (Facebook, Twitter, blogs). The rise of social media can be a early indicator for news before it is released/published. This project will analyze the market based on how the President tweets during certain events.
2. DataSets
In this project, two datasets will be used -
-
The NASDAQ values from November 2016 to January 2020. This data was obtained through Yahoo! Finance and includes Date, Open, High, Low, Close, Adj Close, and Volume for a given day.
-
President Trump’s tweets during the periods of November 2016 to January 2020 is over 41,000 tweets. The data includes id, link, content, date, retweets, favorites, mentions, hashtags, and geo for every tweet in the time frame. Since the performance of the analysis is on a daily basis, tweets will be split up by Date. This data is available on Kaggle (https://www.kaggle.com/austinreese/trump-tweets?select=trumptweets.csv).
To strengthen the analysis, even more, some code from the 2016 election’s analysis of markets may be utilized but the focus will be on the markets during the Trump administration. Rally data maybe introduced in order to have a deeper sense of some of the tweets when it comes to important news that is announces at President Trump’s rallies. In order to have a realistic and strong analysis, the financial data needs to be aligned with the timing of tweets but news that has already started to affect the markets before a tweet has been sent out needs to be taken into account.
3. Data Cleaning and Preprocessing
The data required for this project is stock market data and Twitter data from President Trump. Stock market data was collected from Yahoo Finance’s API. This data was saved to a CSV file then imported using Pandas. The Twitter data was collected by a Kaggle user and is imported though Kaggle’s API or through the use of a local copy saved from the site. The data obtained needs to be cleaned and pre-processed in order to make it reliable for analysis through the use of Pandas, Regex, and Matplotlib.
3.1 Twitter Data
When importing the Twitter data, there are several things that are noticed when printing the first five rows. Three of the columns mention, hashtags, and geo are currently showing NaN. After calculating the missing values, all the values in these columns are missing or are zero so we can drop these columns from the dataframe.
The tweets are one of the last columns needed to be cleaned. The text of the tweets needs to be uniformed in order to conduct analysis. Removing punctuations was the first step followed by removing content specifically seen in tweets. These could be the word retweet, the hashtag symbol(#), the @ symbol followed by a username, and any hyperlinks that could be in a tweet.
3.2 Stock Data
Stock data has a unique set of challenges when it comes to cleaning. Unlike tweets, stock data is only available Monday through Friday and is not available for holidays that the market is closed. In order to have a complete dataset, several options are available. One option is to drop the tweets that fall on a weekend. This would not be useful since markets can react to news that happens on the weekend. Another option is that “if the NASDAQ value on a given day is x and the next available data point is y with n days missing in between, we approximate the missing data by estimating the first day after x to be (y+x)/2 and then following the same method recursively till all gaps are filled” 1.
4. Methodology/Process
The collection of finance and Twitter data will be used to visualize the results. Some of Twitter or dataset data will need to be cleaned and classified to build the model. The methodology is composed of the following steps:
- Use data from President Trump’s personal twitter and data from Yahoo Finance API to help visualize
- Data cleaning and extraction
- Sentiment Analysis
Sentiment analysis is a key component to categorize President Trump’s tweets. Polarity and subjectivity are the two metrics that are used to classify each tweet. Polarity measures the opinion or emotion expressed in a piece of text; the value is returned as a float within the range of -1.0 to 1.0. Subjectivity, on the other hand, reflects the feelings or beliefs in a piece of text; the value is returned as a float within the range 0.0 to 1.0 where 0.0 is very objective and 1.0 is very subjective. TextBlob is the library utilized for processing the tweet’s polarity and subjectivity. The sentiment method is called along with the methods for polarity and subjectivity in their own functions. The returned values are added into two columns in the dataframe.
The plot used for the sentiment analysis is a scatter plot. This will allow for each tweet to be plotted with their respected polarity and subjectivity. A line plot is the best plot to used in order to easily visualize market price verses the sentiment of the tweets. In plotting the line for the sentiment of tweets, several issues arise. The first major issues is that multiple tweets are published on a given day with varying degrees of sentiment. The line graph will display a vertical line for all the points represented. One solution is to take the average of the days tweets and use this new value on the graph. This method can be aligned on the same axes as the stock market data.
5. Preliminary Analysis and EDA
5.1 Twitter Data
When starting to conduct preliminary analysis and exploratory data analysis (EDA), it is helpful to first check for any null values in the data and there are no null values in the twitter data.
The date column is a column that is needed to track the amount of tweets per month and year. In the column, the timestamp and the date are combined so this need to be separated in several ways. The first being separating the date from the timestamp into its own column. This is followed up by separating the date into 4 columns for day, month, year and month-year in order to track tweets based on specified criteria.
After graphing the amount of tweets per year, the observation is that 2016 and 2020 have a low tweet count. The reminder is that the data starts in November 2016 making 2016 have two months of data compared to 2020 with only one month being January. From 2017 through 2019, we can see that the amount of tweets increases by almost a thousand every year. The tweets per month tell a different story. The amount varies greatly over the years with the greatest amount being near the end of 2016 and the beginning of 2017. The sentiment of the tweets show that a majority of the tweets are a little skewed to the right of the graph. This shows that may of the President tweets are positive in some aspect as well as have a personal opinion, emotion or judgement.
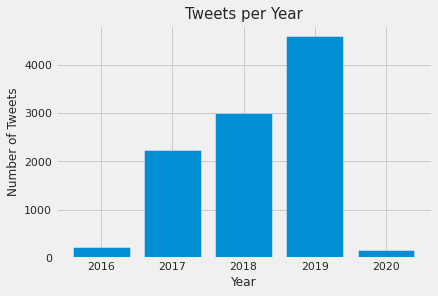
Figure 1: Number of Tweets per Year
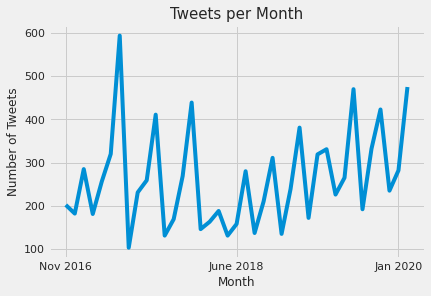
Figure 2: Number of Tweets per Month
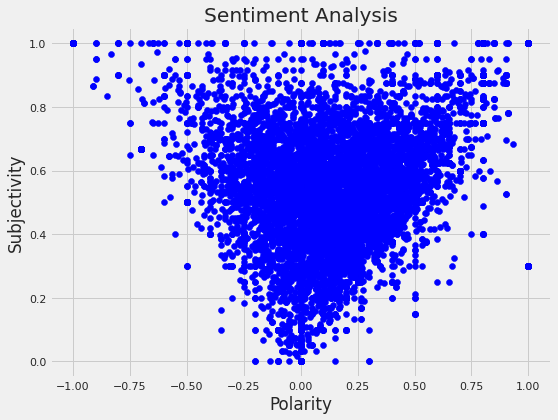
Figure 3: Sentiment Analysis of Tweets
5.2 Stock Data
Similar to the twitter data, checking for null values is important but since the data is from Yahoo! Finance there are no missing values on the days that the markets are opened.
Once graphing the open and closed prices of the NASDAQ, there seems to be an general upwards trend in the market over the time period.
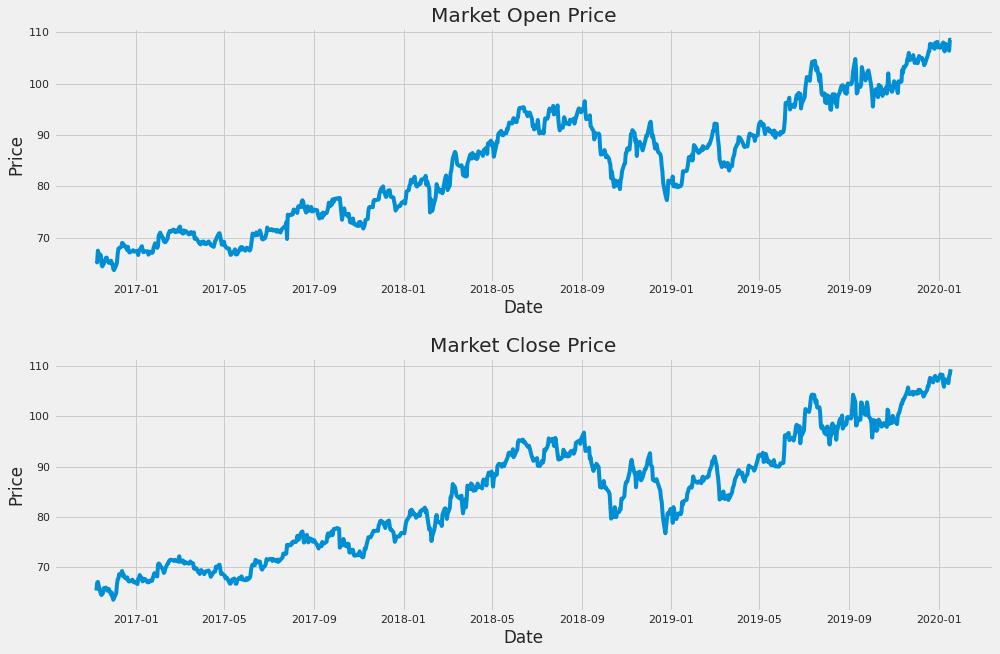
Figure 4: Open and Close Price of the NASDAQ
6. Defining events during Trump’s presidency
6.1 The Impeachment of President Trump
After weeks of talks among Congress, the House of Representatives have voted to impeach President Trump on two charges: abuse of power and obstruction of Congress on December 18, 2019. Since the country’s founding in 1776, only three presidents have faced impeachment from Congress: Andrew Johnson, Bill Clinton and now Donald Trump. This move has been widely advocated for since his election in 2016. “In September 2019, news leaked of a phone call between President Trump and Ukrainian President Volodymyr Zelensky regarding an investigation into Hunter Biden, son of then Democratic candidate Joe Biden, for his dealings in Ukraine” 3. The sentiment analysis preformed on tweets that are published at the start of November though the end of 2019. The graph shows a steady amount of subjectivity and polarity through much of November. In the final week of November, when the House Intelligence Committee’s public hearings were concluding, a large spike in subjectivity as well as polarity shows that President Trump was trying to discredit the individuals testifying, declaring the whole impeachment a witch hunt, or making a case of all the good he has done for teh country. The NASDAQ shows that the opening price went down when the Articles of Impeachment were announced but when the House voted to approve the articles started in mid December, the stock price is on an upward trend. The daily change points out that the price of the stock was fluctuating quite a bit during the initial stages of the impeachment hearing as well as the House vote on the Articles of Impeachment.
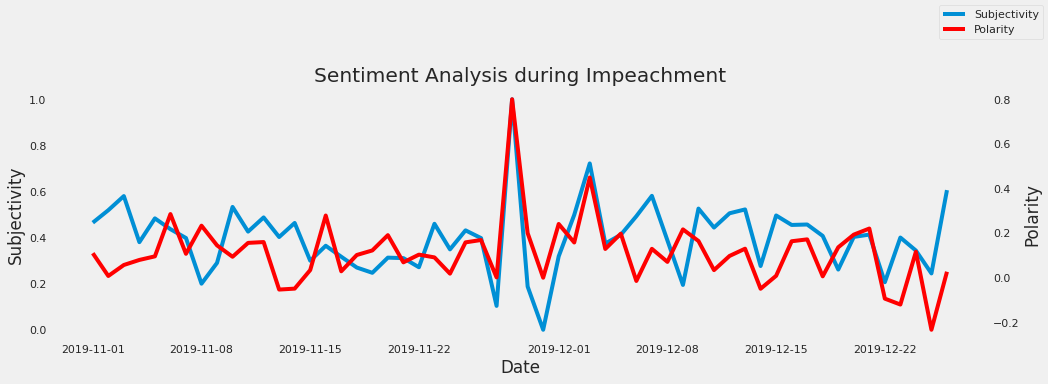
Figure 5: Sentiment Analysis during Impeachment
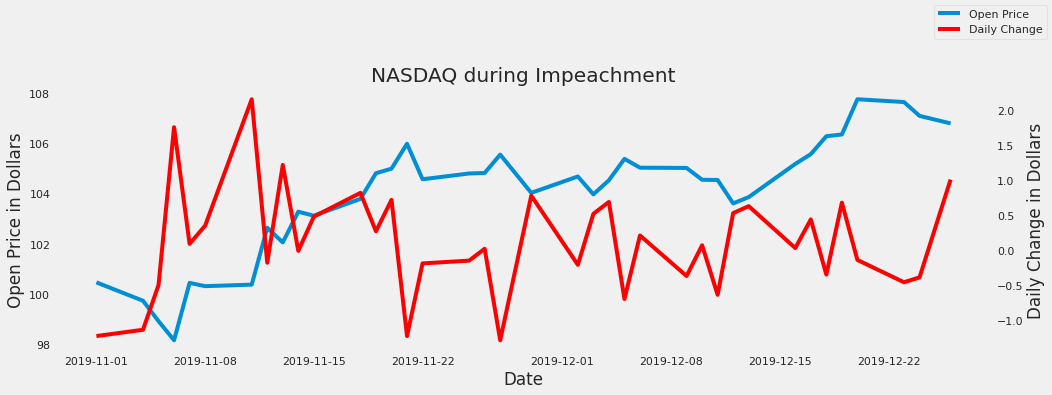
Figure 6: Open and Daily Change Price during Impeachment
6.2 The Dakota Access and Keystone XL pipelines approval
One of the first moves President Trump made when arriving into office was to approve the Dakota Access and Keystone XL pipelines. “Both of the pipelines were blocked by the Obama administration due to environmental concerns, but President Trump has questioned climate change and promised to expand energy infrastructure and create jobs”4. The Keystone pipeline would span 1,200 miles across six states, moving over 800,000 barrels of oil daily from Canada to the Gulf coast. The Dakota Access pipeline would move oil from North Dakota all the way to Illinois. “The Standing Rock Sioux tribe, whose reservation is adjacent to the pipeline, staged protests that drew thousands of climate change activists to the rural area of Cannon Ball, North Dakota” 4. The sentiment analysis shows a high polarity and subjectivity three days before the signing of the presidential memorandum but drops sharply during the event. Subjectivity has a quick resurgence but polarity stays low as time goes on. In the days leading up to the signing of the pipelines on January 24th, the opening price has an upward trend and stays fairly consistent in the following days. Daily change has a big jump at the end of January but falls dramatically and does not reach the level it was once at, this could be due to the protests that followed the approval or companies reevaluating their positions on the pipeline.
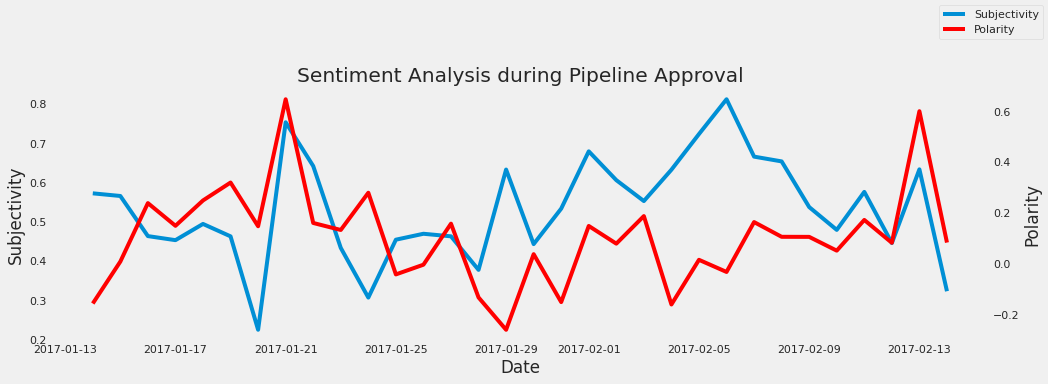
Figure 7: Sentiment Analysis during Dakota Approval
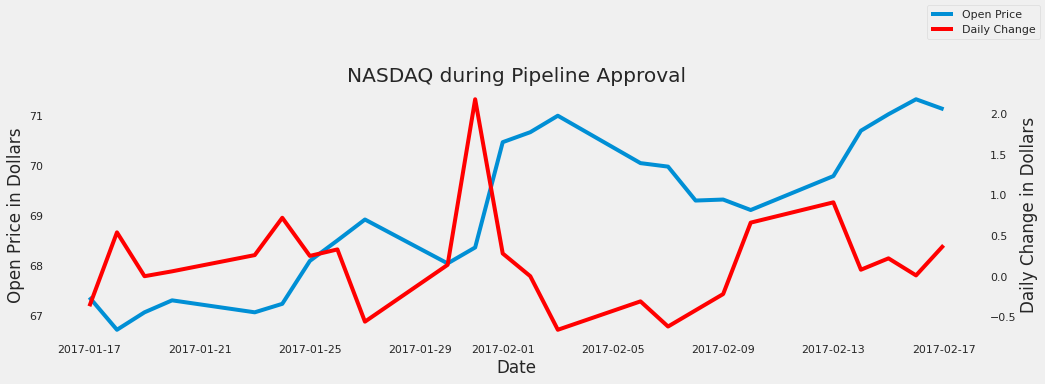
Figure 8: Open and Daily Change Price during Dakota Approval
6.3 The Government Shutdown
On December 21, 2018 the United States Government shutdown. “At the heart of the dispute is Trump’s demand for just over $5 billion toward a long-promised wall along the US-Mexico border” 5. The shutdown affected a part of the federal government such as homeland security, transportation, and agriculture. “The problems caused by the shutdown are wide-ranging, from waste piling up in national parks to uncertainty for 800,000 federal workers about when their next paycheck will come” 5. This shutdown was the longest shutdown in the modern era coming to an end on January 25, 2019 after 35 days. The sentiment analysis tells that the tweets shared during the shutdown are lower in terms of polarity with a majority of tweets being higher in subjectivity. A interesting note is that subjectivity on the day of the shutdown dropped to zero but shot up quickly the next day. There was no significant movement during the whole shutdown until the start of February when polarity soared and subjectivity dropped. A potential reason why there was no significant movement in the analysis was that the president wanted to get his piece of legislation through Congress but Congress was not going to approve his legislation. Prior to the government shutdown, the opening prices fell by 10 dollars with the lowest being around the time the shutdown began. The new year shows stock on a steady increase during the month of January, when the shutdown was lifted. Daily change was on the rise when the shutdown began but swiftly dropped at the start of the new year but recovered and stayed relatively stabled throughout the shutdown.
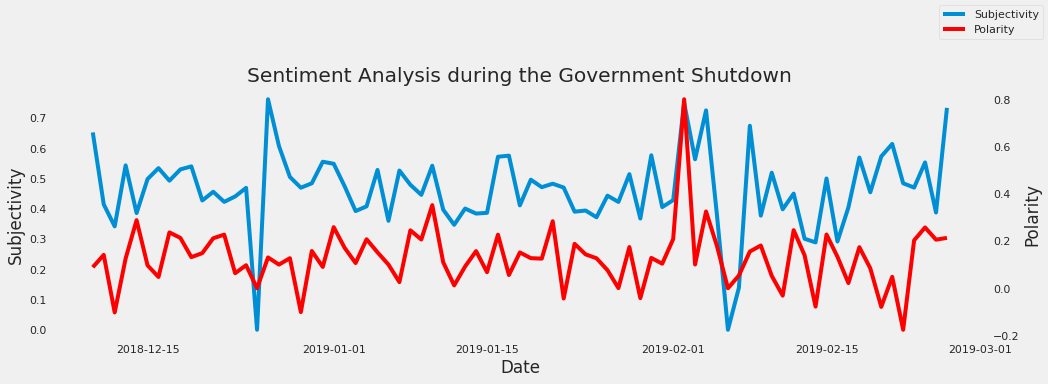
Figure 9: Sentiment Analysis during the Government Shutdown
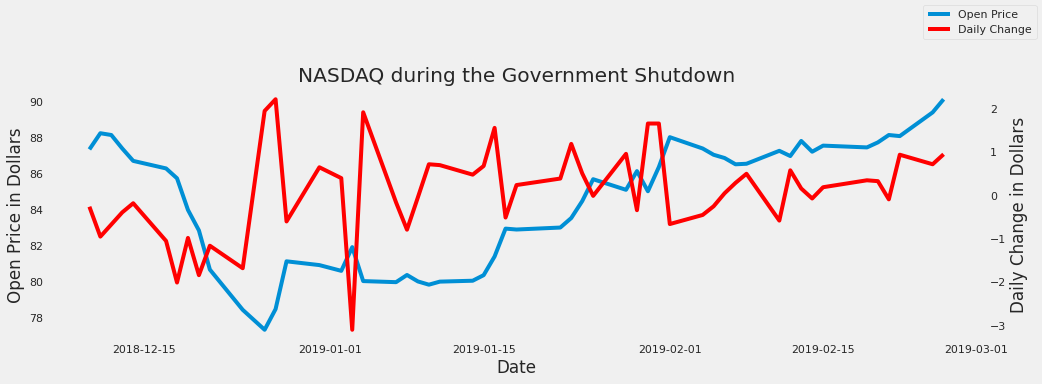
Figure 10: Open and Close Price during the Government Shutdown
7. Conclusion
The investigation showed the relation between President Trump’s tweets and the NASDAQ during certain events. The results pointed that a majority of tweets were positive in polarity with subjectivity being higher or sometimes lower depending on the event. The NASDAQ had some interesting reactions based on the events. In highly important events, the stock price tended to have an upward trajectory but leading up to the event the price would go down. These results show that the content of the President’s tweets have some impact in terms of the market movements, but many factors go into the price of the market such as foreign relations and how companies are preforming. Finally, it is worth mentioning that the analysis doesn’t take into account some factors. Weekends were a factor that was not included into the stock market data. Tweets from the President’s official account were not taken into account in this analysis. All of these remaining areas can be added in future research.
8. References
-
Goel, A. and Mittal, A., 2011. Stock Prediction Using Twitter Sentiment Analysis. [online] cs229.stanford.edu. Available at: http://cs229.stanford.edu/proj2011/GoelMittal-StockMarketPredictionUsingTwitterSentimentAnalysis.pdf. ↩︎
-
J. Bollen, H. Mao, and X. Zeng, Twitter mood predicts the stock market. Journal of Computational Science, vol. 2, no. 1, pp. 1–8, 2011. ↩︎
-
President Donald Trump impeached, History.com, 05-Feb-2020. [online]. Available at: https://www.history.com/this-day-in-history/president-trump-impeached-house-of-representatives. ↩︎
-
D. Smith and A. Kassam, Trump orders revival of Keystone XL and Dakota Access pipelines, The Guardian, 24-Jan-2017. [online]. Available at: https://www.theguardian.com/us-news/2017/jan/24/keystone-xl-dakota-access-pipelines-revived-trump-administration. ↩︎
-
Bryan, B., The government shutdown is now the longest on record and the fight between Trump and Democrats is only getting uglier. Here’s everything you missed. 21-Jan-2019. [online]. Available at: https://www.businessinsider.com/government-shutdown-timeline-deadline-trump-democrats-2019-1. ↩︎