Rank Forecasting in Car Racing
9 minute read
Rank Forecasting in Car Racing
![]()
![]() Status: final, Type: Project
Status: final, Type: Project
- Jiayu Li, fa20-523-349
- Edit
Abstract
The IndyCar Series is the premier level of open-wheel racing in North America. Computing System and Data analytics is critical to the game, both in improving the performance of the team to make it faster and in helping the race control to make it safer. IndyCar ranking prediction is a practical application of time series problems. We will use the LSTM model to analyze the state of the car, and then predict the future ranking of the car. Rank forecasting in car racing is a challenging problem, which is featured with highly complex global dependency among the cars, with uncertainty resulted from existing exogenous factors, and as a sparse data problem. Existing methods, including statistical models, machine learning regression models, and several state-of-the-art deep forecasting models all perform not well on this problem. In this project, we apply deep learning methods to racing telemetry data. And compare deep learning with traditional statistical methods (SVM, XGBoost).
Contents
Keywords: Time series forecasting, deep learning.
1. Introduction
Indy500 is the premier event of the IndyCar series1. Each year, 33 cars compete on a 2.5-mile oval track for 200 laps. The track is split into several sections or timeline. E.g., SF/SFP indicate the start and finish line on the track or on the pit lane, respectively. A local communication network broadcasts race information to all the teams, following a general data exchange protocol. We aim to predict the leading car in the future through telemetry data generated in real time during the race. Given a prediction step t_p, and a time point t_0 in the game, we predict the following two events:
- Whether the currently leading car continue to lead at time t_0 + t_p.
- Which car is the leading car at time t_0 + t_p.
2. Background Research and Previous Work
In many real-world applications, data is captured over the course of time, constituting a Time-Series. Time-Series often contain temporal dependencies that cause two otherwise identical points of time to belong to different classes or predict different behavior. This characteristic generally increases the difficulty of analysing them. The traditional statistical learning model (Naive Bayes, SVM, Simple Neural Networks) is difficult to deal with the problem of time series prediction, since the model is unable to understand the time-series dependence of data. Traditional time series prediction models such as autoregressive integrated moving average (ARIMA) can only deal with linear time series with certain periodicity. The anomaly events and human strategies in the racing competition make these methods no longer applicable. Therefore, time series prediction models (RNN, GRU, LSTM, etc.) based on deep learning are more suitable for solving such problems. Previous racing prediction attempts such as 2345 could not make real-time predictions because the data they used was based on Lap, that is, new data would only be generated when the car passed a specific position. And we will try to use high-frequency telemetry data to make predictions.
This article is different from 5 in at least three points:
- The resolution of the data is different. This article uses telemetry data. The telemetry data generates 7 to 8 data points per second. After preprocessing, we sample the data to 1 data point per second. The data used in 5 is based on “Lap”, that is, the new data will only be recorded when the car passes the starting point.
- The prediction model is different. This article uses LSTM for prediction, while 5 uses DeepAR-based models for prediction.
- The definition of ranking is different. What this article predicts is: Given a certain time t, predict which car will lead at t+tp. And the output of 5 is: predict the rank of each car to complete the nth lap. One is to predict the position of the car in space at a given time; the other is to give a spatial position (usually the starting point of the track), and then predict the time for the car to pass that position.
3. Choice of Data-sets
There are two main sources of data: One is the game record from 2013 to 2019. The other is telemetry data for 2017 and 2018.
The race record only includes the time spent in each section and does not include the precise location of every two cars at a certain point in time. Telemetry data is a high-resolution data, each car will produce about 7 records per second, we use telemetry data to estimate the position of each car at any time. In order to expand the training data set, we used interpolation to convert ordinary race records into a time series of car positions. If we assume that the speed of the car within each section does not change, then the position of the car at time T can be calculated as follows: LapDistance(T) \approx L \frac{T-T_1}{T_2 - T_1} . T_1 and T_2 are the start and end time of the current section. L=2.5 miles is the length of the section.
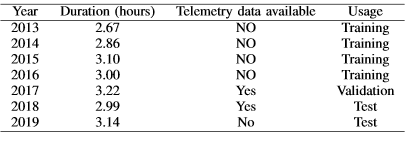
Table 1 : Indy 500 data sets
Structure of the log file
The Multi-Loop Protocol is designed to deliver specific dynamic and static data that is set up and produced by the INDYCAR timing system. This is accomplished by serially streaming data that is broken down into different record sets. This information includes but is not limited to the following:
- Completed lap results
- Time line passing or crossing results
- Completed section results
- Current run or session information
- Flag information
- Track set up information including segment definitions
- Competitor information
- Announcement information
The INDYCAR MLP is based on the AMB Multi-Loop Protocol version 1.3. This document contains the INDYCAR formats for specific fields not defined in the AMB document.
Record Description:
Every record starts with a header and ends with a CR/LF. Inside the record, the fields are separated by a “broken bar” symbol 0xA6 (not to be confused with the pipe symbol 0x7C). The length of a record is not defined and can therefore be more than 256 characters. The data specific to each record Command is contained between the header and CR/LF.
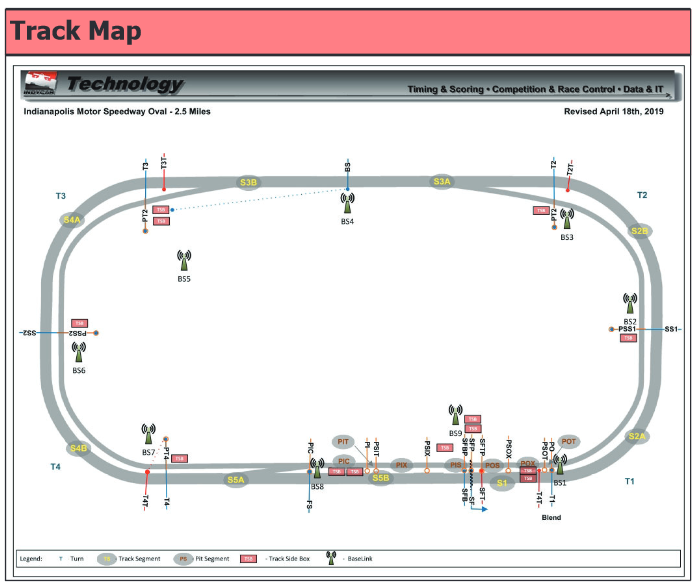
Figure 1 : Indy 500 track map
4. Methodology
Data preprocessing
There are two main sources of data: One is the game record from 2013 to 2019. The other is telemetry data for 2017 and 2018.
The race record only includes the time spent in each section and does not include the precise location of every two cars at a certain point in time. Telemetry data is a high-resolution data, each car will produce about 7 records per second, we use telemetry data to estimate the position of each car at any time. In order to expand the training data set, we used interpolation to convert ordinary race records into a time series of car positions. If we assume that the speed of the car within each section does not change, then the position of the car at time T can be calculated as follows: LapDistance(T) \approx L \frac{T-T_1}{T_2 - T_1} . T_1 and T_2 are the start and end time of the current section. L=2.5 miles is the length of the section.
The preprocessing mainly includes 3 operations.
- Stream data interpolation. In order to expand the training data set, we used interpolation to convert ordinary race records into a time series of car positions.
- Data normalization, scale the input data to the range of -1 to 1.
- Data sorting. Due to the symmetry of the input data, that is, any data exchanged between two cars can still get a legal data set. Therefore, a model with more parameters is required to learn this symmetry. In order to avoid unnecessary complexity, we sort the data according to the position of the car. That is, the data of the current leading car is placed in the first column, the data of the currently ranked second car is placed in the second column, and so on. This helps to compress the model and improve performance.
Feature selection
The future ranking of a car is mainly affected by two factors: One is its current position: the car that is currently leading has a greater probability of being ahead in the future; the other is the time of the last pit stop: because the fuel tank of each car is limited, Entering pit stop, the possibility of it leading in the future will be reduced.
Therefore, we choose the following characteristics to predict ranking:
- The current position of each car (Lap and Lap Distance)
- Time of the last Pit Stop of each car
Time series prediction problems are a difficult type of predictive modeling problem. Unlike regression predictive modeling, time series also adds the complexity of a sequence dependence among the input variables. A powerful type of neural network designed to handle sequence dependence is called recurrent neural networks. The Long Short-Term Memory network or LSTM network is a type of recurrent neural network used in deep learning because very large architectures can be successfully trained.
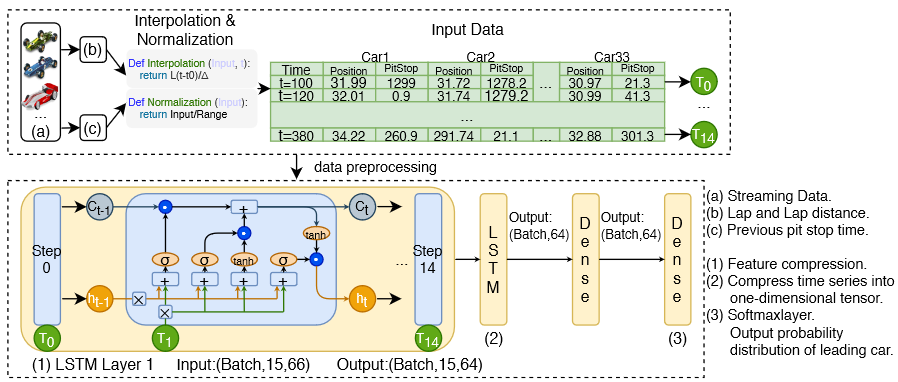
Figure 2 : Work flow and model structure
5. Inference
Table shows the experimental results, which verify our hypothesis that the time series prediction model based on deep learning obtained the highest accuracy. Although the LSTM model achieves the highest accuracy, its advantages are not as obvious as RankNet. This is because the telemetry data of racing cars is non-public, and the data available for training are limited.
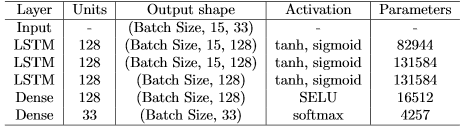
Table 2 : LSTM model parameters
According to the experimental results in Table 6, we draw the following conclusions:
- The LSTM model has higher accuracy in time series forecasting.
- Limited by the size of the training data set (only the telemetry data for 2 games is available), the accuracy improvement obtained by LSTM is not as obvious as RankNet.
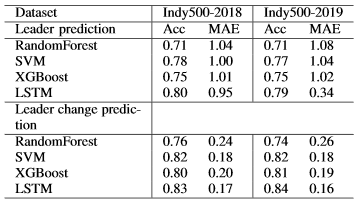
Table 3 : Model accuracy comparison
6. Conclusion
The prediction problem of racing cars has the characteristics of non-linearity, non-periodicity, randomness, and timing dependence. The traditional statistical learning model (Naive Bayes, SVM, Simple Neural Networks) is difficult to deal with the problem of time series prediction, since the model is unable to understand the time-series dependence of data. Traditional time series prediction models such as ARMA / ARIMA can only deal with linear time series with certain periodicity. The anomaly events and human strategies in the racing competition make these methods no longer applicable. Therefore, time series prediction models (RNN, GRU, LSTM, etc.) based on deep learning are more suitable for solving such problems.
7. Acknowledgements
The author would like to thank Dr. Gregor Von Laszewski, Dr. Geoffrey Fox, and the associate instructors in the FA20-BL-ENGR-E534-11530: Big Data Applications course (offered in the Fall 2020 semester at Indiana University, Bloomington) for their continued assistance and suggestions with regard to exploring this idea and also for their aid with preparing the various drafts of this article.
8. References
-
IndyCar Dataset. https://racetools.com/logfiles/IndyCar/. visited on 04/15/2020 ↩︎
-
M4 Competition. https://forecasters.org/resources/time-series-data/m4-competition/. ↩︎
-
C. L. W. Choo. Real-time decision making in motorsports: analytics forimproving professional car race strategy, PhD Thesis, MassachusettsInstitute of Technology, 2015. ↩︎
-
T. Tulabandhula.Interactions between learning and decision making.PhD Thesis, Massachusetts Institute of Technology, 2014. ↩︎
-
Peng B, Li J, Akkas S, Wang F, Araki T, Yoshiyuki O, Qiu J. Rank Position Forecasting in Car Racing. arXiv preprint https://arxiv.org/abs/2010.01707/. ↩︎