Project: Analyzing Hashimoto disease causes, symptoms and cases improvements using Topic Modeling
18 minute read
![]()
![]()
Status: final, Type: Project
Sheimy Paz, su21-reu-372, Edit
Abstract
This project proposes a new view of Hashimoto’s disorder, its association with other pathologies, possible causes, symptoms, diets, and recommendations. The intention is to explore the association of Hashimoto disorder with disease like h pylori bacteria, inappropriate diet, environmental factors, and genetic factors. To achieve this, we are going to utilize AI in particular topic modeling which is a technic used to process large collection of data to identifying topics. Topic modeling is a text-mining tool that help to correlate words with topics making the research process easy and organized with the purpose to get a better understanding of the disorder and the relationship that this has with other health issues hoping to find clear information about the causes and effect that can have on the human body. The dataset was collected from silo breaker software, which contains information about news, reports, tweets, and blogs. The program will organize our findings highlighting key words related to symptoms, causes, cures, anything that can apport clarification to the disorder.
Contents
Keywords: Thyroid disease, Hashimoto, H Pylori, Implants, Food Sensitivity, Diary sensitivity, Healthy Diets, Exercise, topic modeling, text mining, BERT model.
1. Introduction
Hashimoto thyroiditis is an organ-specific autoimmune disorder. its symptoms were first described 1912 but the disease was not recognized until 1957. Hashimoto is an autoimmune disorder that destroys thyroid cells and is antibody-mediated 1. In a female-to-men radio at least 10:4 women are more often affected than men. The diagnostic is often called between the ages of 30 to 50 years 2. Pathologically speaking, Hashimoto stimulates the formation of antithyroid antibodies that attack the thyroid tissue, causing progressive fibrosis. Hashimoto is believe to be the concequence of a combination of mutated genes and eviromental factors3. The disorder is difficult to diagnose since in the early course of the disease the patients may or may not exhibit symptoms or laboratory findings of hyperthyroidism, it may show normal values because the destruction of the gland cells may be intermittent 1. Clinical and epidemiological studies suggest worldwide that the most common cause of hypothyroidism is an inadequate dietary intake of iodine.
Due to the arduous labor to identify this disorder a Machine Learning algorithm based on prediction would help to identify Hashimoto in early stages as well as any other health issues related to it 4. This will be helpful for patients that would be able to get the correct treatment in an early stage of the illness avoiding future complications. This research algorithm was mainly intended to find patient testimonies of improvements, completed healed cases, early symptoms, trigger factors or any useful information about the disorder.
Hashimoto autoimmune diseases have been linked to the infection caused by H pylori bacteria. H pylori is until the date the most common chronic bacterial infection, affecting half of the world’s population and is known for the presence of Caga antigens which are virulent strains that have been found in organ and non-organ specific autoimmune diseases 23. Another important trigger of Hashimoto disorder is the inadequate modern diet patterns and the environmental factors that are closely related to it 4. For instance, western diet consumption is an essential factor that trigs the disorder since this food is highly preserved and predominate the consumption of artificial flavors and sugars which have dramatically increase in the past years, adding to it the use of chemicals and insecticides in the fruits and vegetables and the massive introduction of hormones for meat production, all this can be the cause of the rise of autoimmune diseases 5.
We utilize deep learning BERT model to train our dataset. BERT is a superior performer Bidirectional Encoder, which superimposes 12 or 24 layers of multiheaded attention in a Transformer 1. Bert stands for Bidirectional(read from left to right and vice versa with the purpose of an accurate understanding of the meaning of each word in a sentence or document) Encoder Representations from Transformers(the used of transformers and bidirectional models allows the learning of contextual relations between words). Notice that BERT uses two training strategies MLM and NSP.
Masked Lenguage Model (MLM) process is made by masking around 15% of token making the model predict the meaning or value of each of the masked words. In technical word it requires 3 steps Adding a classification layer on top of the encoder output, Multiplying the output vectors by the embedding matrix, transforming them into the vocabulary dimension. And lastly calculating the probability of each word in the vocabulary with SoftMax. Here we can see an image of the process 6.
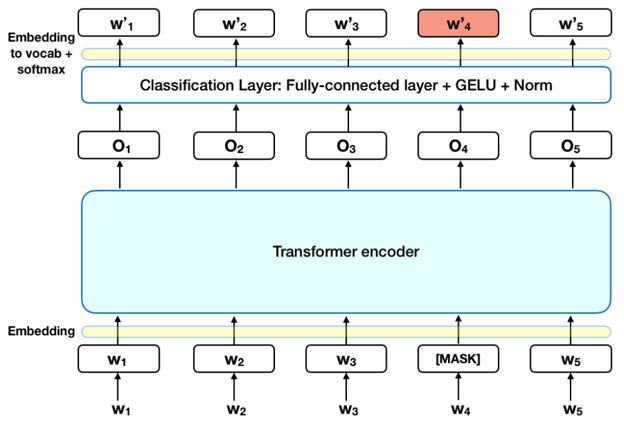
MLM Bert Figure: “Masked Language Model Figure Example” 6.
Next Sentence Prediction (NSP) process is based in sentence prediction. The model obtains pair of sentences as inputs, and it is train to predict which is the second sentence in the pair. In The training process 50% of the input sentences are in fact first and second sentence and in the other 50% the second sentences are random sentences used for training purposes. The model is able to distinguish if the second sentence is connected to the first sentence by a 3-step process. An CLS (the reserved token to represent the start of sequence) is inserted at the beginning of the first sentence while the SEP (separate segments or sentence) is inserted at the end of each sentence. And embedding indicating sentence A or B is added to each token, and lastly a positional embedding is added to each token to indicate its position in the sequence like is shown on the image 6.
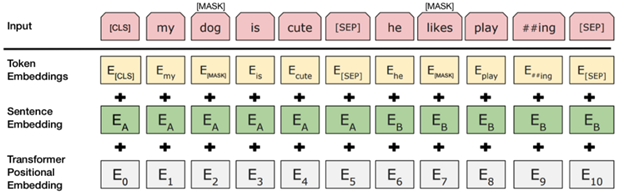
NSP Bert Figure: “Next Sentence Prediction Figure Example” 6.
By the trained model Parameter learning we obtains the word embeddings of the input sentence or input sentence pair in the unsupervised learning framework proceeds by solving the following two tasks: Masked Language Model and Next Sentence Prediction.
We try to use Bert model in the small dataset Hashimoto without any success because the BERT model was overfitting the data points. We use LDA model to train the Hashimoto dataset which allow us to find topic probabilities that we compare with the thyroiditis dataset that was trained with the BERT model-framework.
We used Natural Language Toolkit (NLTK) which is a module that uses the process of splitting sentences from paragraph, split words, recognizing the meaning of those words, to highlighting the main subjects, with the purpose to help to understand the meaning of the document 7. For instance, in our NLTK model we used two data sets Hashimoto and thyroiditis and we were able to identify the top 30 topics connected to these disorders. From the information collected we were able to identify general information like association of the disorder with other health issues. The impact of Hashimoto patient with covid19, long term consequences of untreated Hashimoto, recommendation for advance cases, and diet suggestion for improvement. The used of Natural Language tool kit made a precise and less time consuming research process.
2. Summary Tables
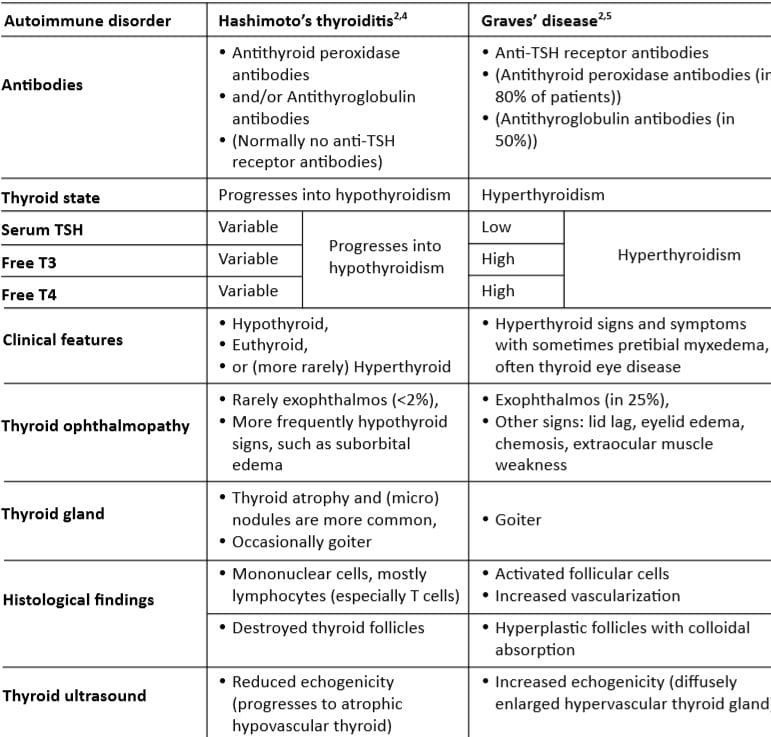
We can observe in this table the differences between this two similar disorders that are frequently misunderstood.
Summary Table 1: “Differences Between Hashimoto’s Thyroiditis and Grave’s Disease” 8.
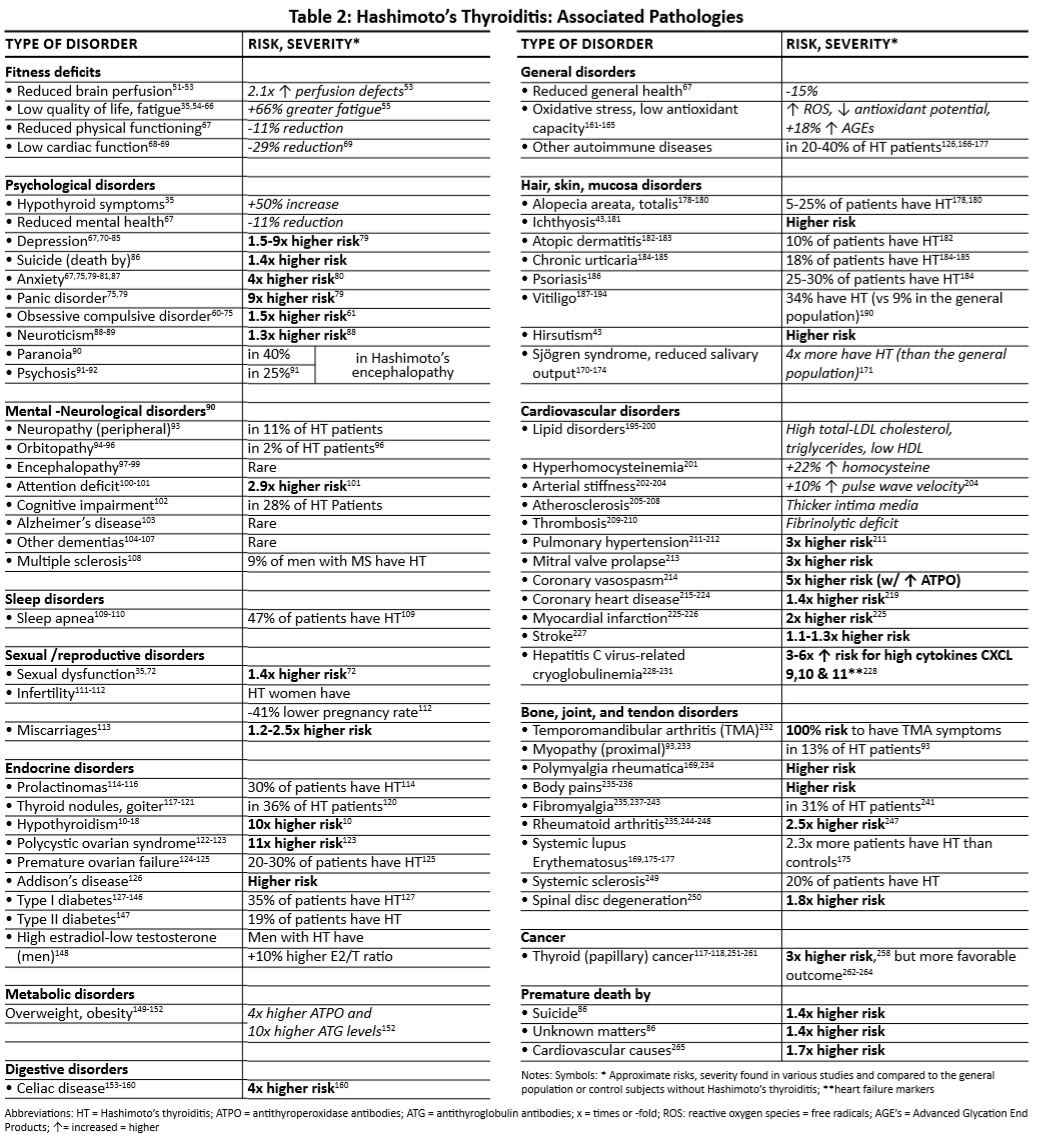
Summary Table 2: “Hashimoto’s thyroiditis is associated with other important disorders” 8.
Summary Table 3: “Overview of the main dietary recommendations for patients with Hashimoto” 8.
3. Datasets
Silobreaker software was used to obtain scientific information related to the Hashimoto disease coming from different sources such as journals, proceedings, tweets, and news. Our date consists in the fallowing feature: ID, cluster Id, Description, publication date, Source URL, publisher. And the purpose is to analyze the preform of the proposed approach to discover the hiding semantic structures related with Hashimoto and thyroiditis the description from the gather data is used to study the frequency of Hashimoto and thyroiditis appears in the documents and detecting words and phrases patterns within them to automatically clustering work groups.
The dataset was obtained from Silobreaker database which is a commercial database. We got access through Florida A&M University who provided me the right to query the data. the link for the silobreaker information is [Here] (https://www.silobreaker.com/) 9.
This data was preprocessed dropping the columns ‘Id’, ‘ClusterId’, ‘Language’, ‘LastUpdated’,‘CreatedDate’,‘FirstReported’. Also, stop words and punctuation were removed, we convert to lower case all the titles.
The dataset already query can be download in my personal drive [Here](https://drive.google.com/drive/u/0/folders/1Omtnn5e-yH3bbhW0-5fIbLgi8SEyfYBP.
4. Results
The following figures were creating with the help of libraries like gensim. Gensim stands for Generate similar and is an unsupervised library wide used for topic modeling and natural language processing based on modern statistical machine learning 10. it can handle large text collections of data and can preforms task like corpora, building document, word vectors and topic identification, which is one of the technics we used here, and we can observe it in some of the images. Each figure is described and explains the method we used to created it along with the relationship of the key word or major topic to the Hashimoto disorder.
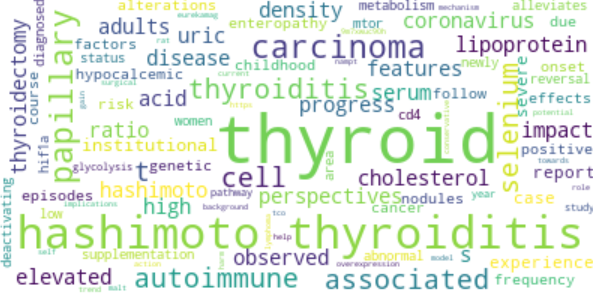
Figure 1: “Example of a Word Cloud Object”
On Figure 1 we observed an example of a word cloud object and represent the difference words found in our dataset and the size of the words means the frequency of the given words in the document. Meaning that the size of the words is proportional to the frequency of its used.
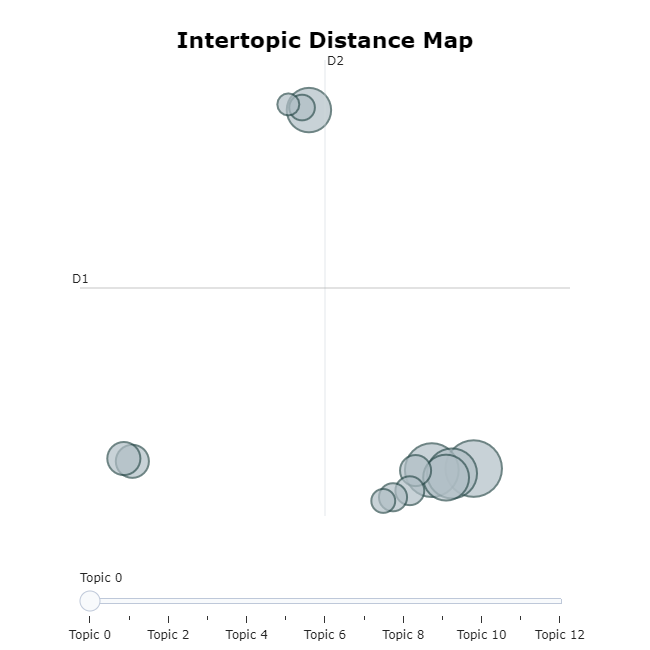
Figure 2: “Example of a Intertopic Distance Map”
Figure 2 shows an Intertopic Distance Map which is a two-dimensional space filled with circles representing the proportional number of words that belongs to each topic making the distance to each other represent the relation between the topics, meaning that topics that are closer together have more words in common. For instance, in topic 1 we observed word like hypothyroidism, Morgan, symptoms after a small search we were able to find that Morgan is a well-known writer that presented thyroiditis symptoms after giving birth which is something that happen to some women’s and then recover after a couple of months, however this increments the risk of developing the syndrome later in their lives 11. On topic 4 we see words like food, levothyroxine, liothyronine, selenium and dietary. the relationship between these words is symptom control, symptoms relive, some natural remedies and supplements 1213.
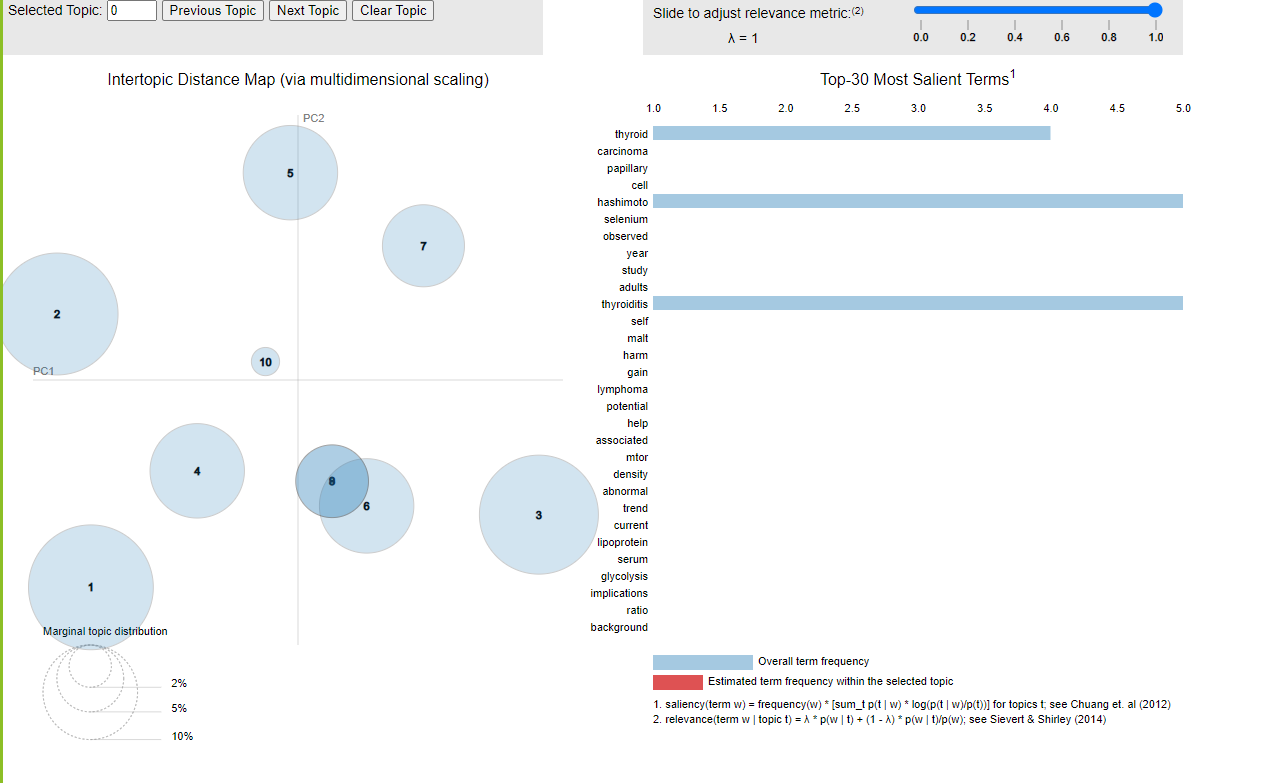
Figure 3: “Top 30 major Topics”
On figure 3 we observed a bar chart that shows 30 major terms. The bars indicate the total frequency of the term across the entire corpus. The size of the bubble measures the importance of the topics, relative to the data. for example, for visualization purposes we used the first topic that include Hashimoto, thyroiditis, and selenium. Saliency is a measure of how much the term talks about the topic. And in terms of findings is important to mentions the relationship between Hashimoto thyroiditis and selenium. Selenium is a suplement recomended for patients with this disorder that have shown a reduction on antibody levels 13.
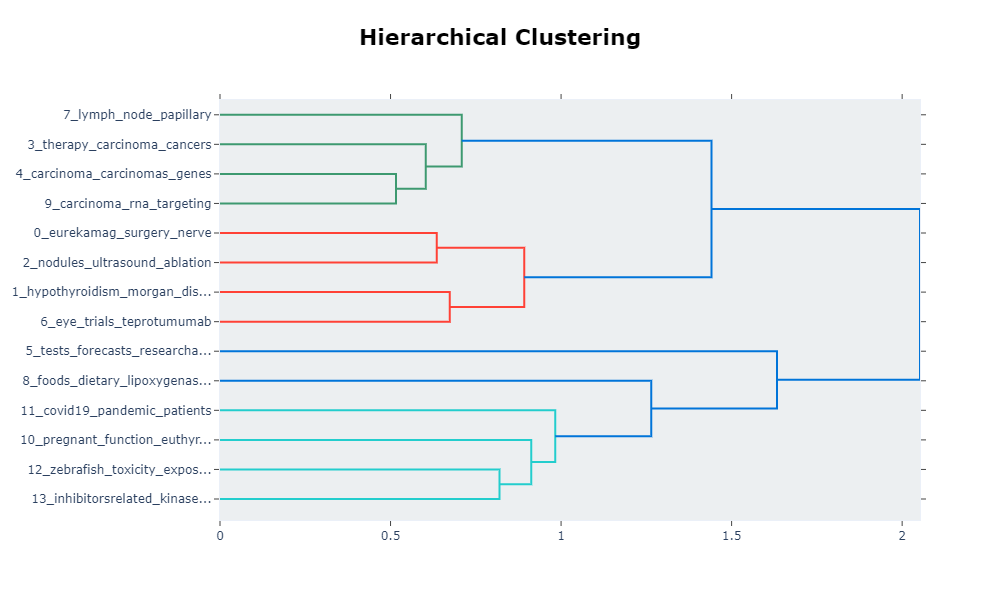
Figure 4: “Example of Hierarchical Clustering chart”
On figure 4 we can see that the dendrograms have been created joining points 4 with 9, 0 with 2, 1 with 6, and 12 with 13. The vertical height of the dendrogram shows the Euclidean distances between points. It is easy to see that Euclidean distance between points 12 and 13 is greater than the distance between point 4 and 9. This is because the algorithm is clustering by similarity, differences, and frequency of words. We observed in the dark green dendrogram topic 7,3,4,9 which are all related to an advance stage of the disorder. we can find the information about certain treatments, causes of the disorder, level of damage at certain stages. On the reds dendrograms we observe topics 0,2,1,6 which are closely related to diagnosis, early symptoms and procedures used for the diagnosis of the disorder.
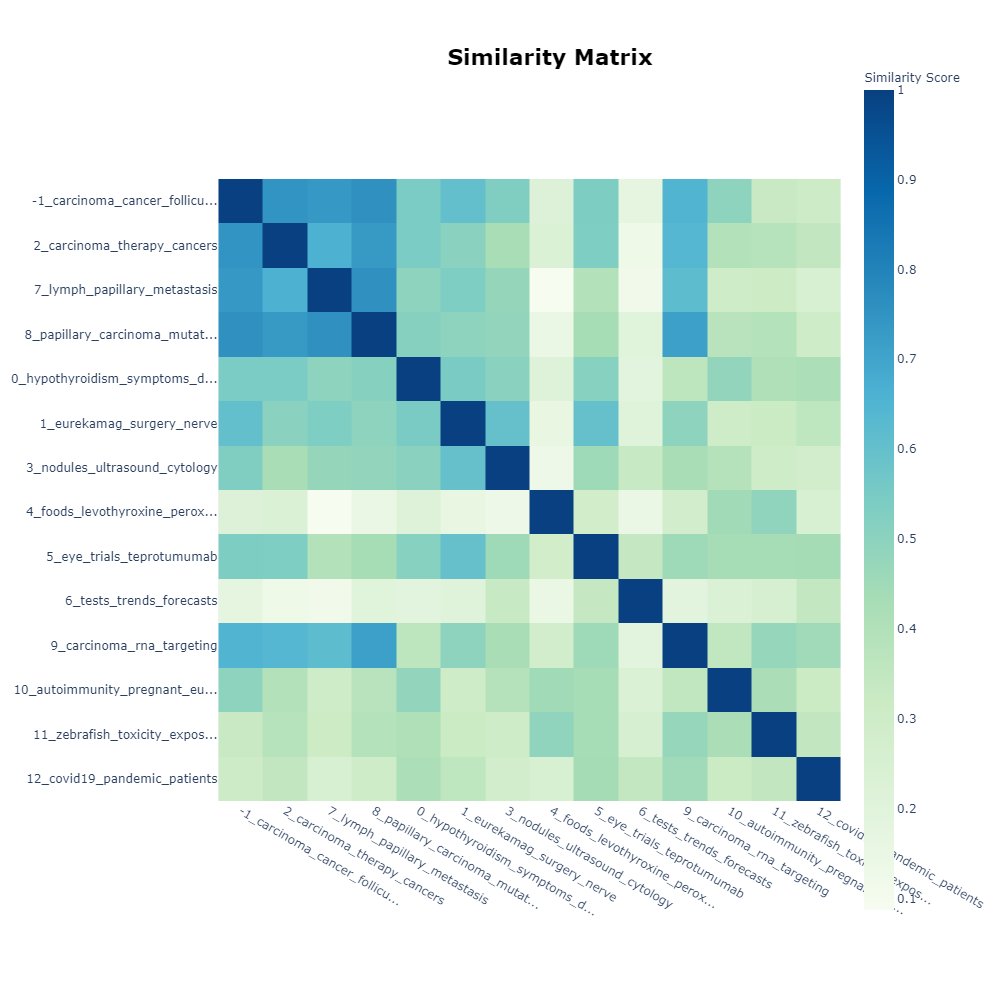
Figure 5: “Exaple of Similarity Matrix Chart”
On figure 5 we can see a similarity matrix chart, the graph is build based on similarity reached from the volume of topic and association by document, therefore the graph show groups of documents that are cluster together based on similarities. in this case the blue square is an indication of a strong similarity, and the green and light green is an indication of different topics. for instance, we are able to derive as a conclusion that carcinoma cancer, carcinoma therapy, lymph papillary metastasis and hypothyroidism are closely related. in facts they are advance stages of the disorder. E.g. Carcinoma therapy is a type of treatment that can be used for this disorder 14.
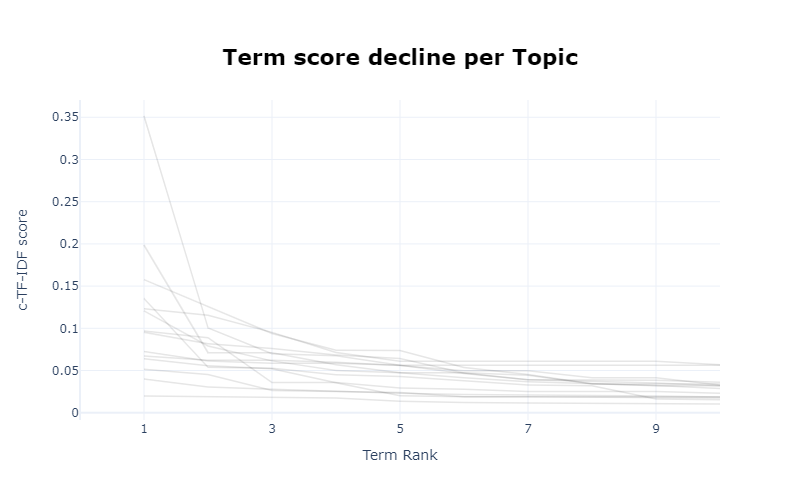
Figure 6: “Example of Term Score Decline Per Topic Chart”
On figure 6 we observed TF-IDF which is an interesting technic used on machine learning that have the ability to give weight to those words that are not frequent in the document but can carry important information. In this example we can see how topic 12, covid19 pandemic patients is the at the top of the chart and then start declining when the rank term increase. The science behind this behave is explain by the TF-IDF which is term frequency - Inverse document frequency. Therefore, covid 19 was a relative new disease, and we do not expect to have a high frequency used in the document. In this case we were able to find information about Hashimoto patients and covid19 which it seems not to causes any extreme symptoms for patient with this disorder others than the ones expected from a healthy person in other words Hashimoto patients have the same risk of a healthy person 15.
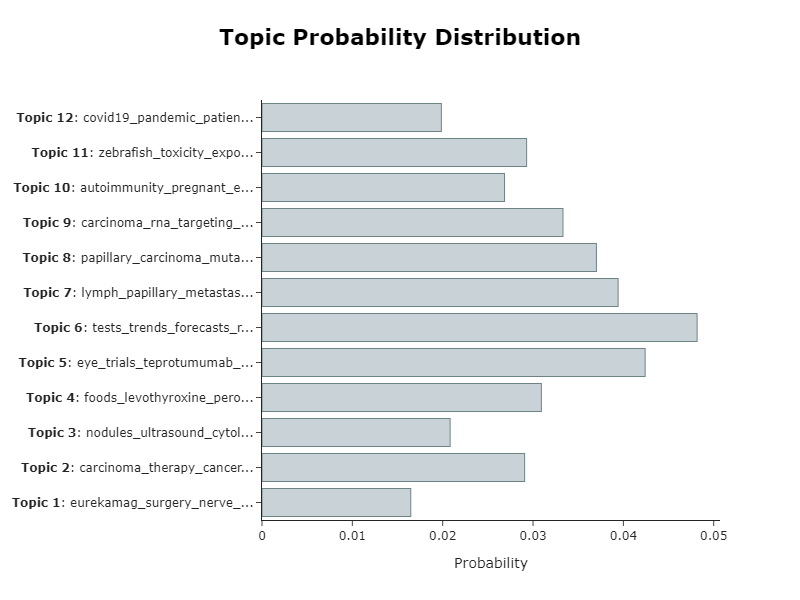
Figure 7: “Example of Topic Probability chart”
On figure 7 we see a probability distribution chart based on each topic frequency and its relationship with the main topic: Hashimoto thyroiditis causes or cure. We can see that topic 12 is the least frequent or least related since most of its content is about covid19. Then we have topic 11 zebrafish which is related to the investigation of the disorder but most of its content is about the research made on zebrafish and how had help researchers to understand thyroid diseases in other no mammals’ animals, but is not closely related to the major point of this project, however, is an interesting research which have provide useful information about thyroiditis 16.
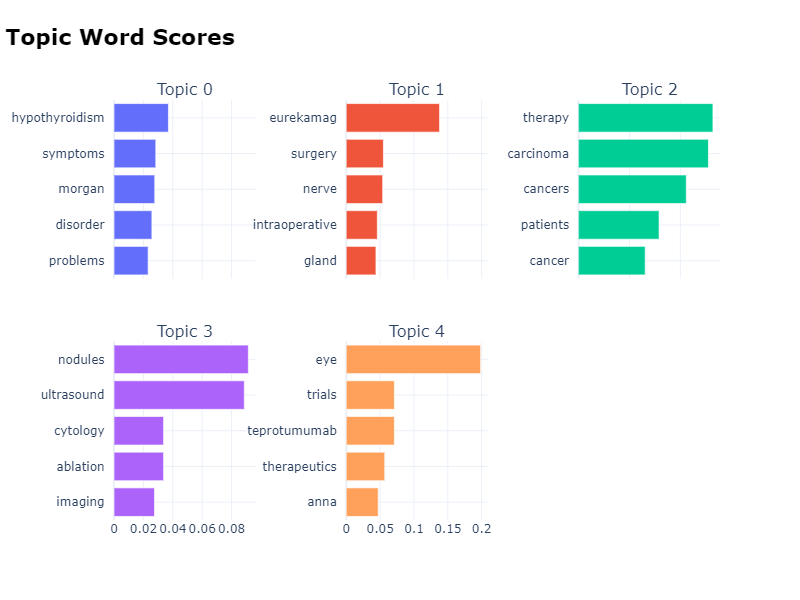
Figure 8: “Example of a Topic Word Score Chart”
On figure 8 we have Topic Word Scores chart that provides a deep understanding of large corpus of texts trough topic extraction. for instance, the data used in this project provide 5 fundamental topics from 0 to 4. Essentially each topic provided closely related words with deep information about the disorder itself, treatments, diagnosis, and symptoms. E.g. in topic number 4 we find a specific word “eye” which it does not seem to have a close relationship with Hashimoto thyroiditis but in facts is related to one of the early symptoms that the human body experiment most likely when is still undiagnosed [16]. In the same topic we also find the word teprotumumab which is an eye relieve medication recommended from doctors to relive the symptoms, in other word is not the cure but it helps 17.
5. Hashimoto Findings
As we can see our findings are wide in aspects of causes which is one of the main keys, because if we know the cause of something most likely we will be able to avoid it. However, this disorder is considered relative knew and have been around for some decades only, but it is necessary to point out the relation of diseases with the environment. Environmental changes are a fact and are affecting us every day even when we don’t notice it. We have seen an exponential increase of Hashimoto cases in the last five decades, and at the same time the last five decades have been potentially related to climate change, high levels of pollution, less fertile soils, increased use of pesticides on food, etc. It would be a good idea to think about our environment and how to help it heal since it will bring benefits for all of us18.
Table Summary: “Finding summary on causes, descriptions and recommendations.”
| Possible Causes | Description | Recomendations |
|---|---|---|
| Genetic predispositions | Genetically linked | Manage stress |
| Dietary errors | Imbalance of iodine intake | Balance is key |
| Nutritional deficiencies | not enough veggies, vitamins and minerals | eat more veggies |
| Hormone deficiencies | lover levels of vit D | Enough sleep, Take some sun light |
| Viral, bacterial, yeast, and parasitic infections. | H pylori, Bad guts microbes | food hygiene |
| Enviromental Factors | Pollution, Pesticides used etc. | Human footprint on environment |
Possible causes
Genetic predispositions, Dietary errors, Nutritional deficiencies, Hormone deficiencies, Viral, bacterial, yeast, and parasitic infections 8.
Hashimoto Trigger Food
Some Food that can trigger Hashimoto are gluten, dairy, some type of grains, eggs, nuts or nightshades, sugar, sweeteners, sweet fruits, including honey, agave, maple syrup, and coconut sugar and high-glycemic fruits like watermelon, mango, pineapple, grapes, canned and dried fruits. Vegetable oil, specially hydrogenated oils, ad trans-fat. Patient with this disorder may experience symptoms of fatigue, rashes, joint pain, digestive issues, headaches, anxiety, and depression after eating some of these foods 19.
Hashimoto recommended Diets
The recommended foods are healthy fats like coconut, avocado, and olive oil, ghee, grass-fed and organic meat, wild fish, healthy fats, fermented foods like coconut yogurt, kombucha, fermented cucumbers and pickle ginger, and plenty of vegetable like Asparagus, spinach, lettuce, broccoli, beets, cauliflower, carrots, celery, artichokes, garlic, onions 19.
Environmental causes of Hashimoto
There have been an increase in the number of Hashimoto cases in the United States since 1950s. These is one of the reason research explain that Hashimoto disorder can be closely related to environmental causes since the rapid increase of cases can not only be related to family gens as it takes at least two generations to acquire and transfer gen mutation. Adding to this that for generation thru history human have been fitting microorganisms than enter our body but for the past centuries our environment has become very hygienic consequently our immune system suddeling was left without aggressors therefore humane start developing more allergies and autoimmune diseases. Another important factor is the balance of iodine intake because too much is as dangerous for people with genetic Hashimoto predisposition but too littler can be also dangerous for patients with the disorder to reduce goiter which is the enlargement of the thyroid glands 18.
It is still not enough research to state that low vitamin D levels are a cause or a consequence of the Hashimoto disorder, but it is a fact that most patients with this disorder have low levels of vitamin D this insufficient this is closely related to insufficient sun exposure 18.
The exposure to certain synthetic pesticide. An important fact is that 9 out of 12 pesticides are dangerous and persistent pollutants 18.
Symptoms of Hashimoto’s
Some of the symptoms are fatigue and sluggishness, sensitivity to cold, constipation, pale and dry skin, dry eyes, puffy face, brittle nails, hair loss, enlargement of the tongue, unexplained weight gain, muscle aches, tenderness and stiffness, joint pain and stiffness, muscle weakness, excessive or prolonged menstrual bleeding, depression, memory lapses, Another symptom reported by some patients was ablation, some patient described as an acceleration of the heart rhythm 20.
Complications
Tissue damage, Abnormal look of the thyroid gland (figure 2), goiter, Heart problems, mental health issues, myxedema, birth defects 20, Nodule (figure 4 Similarity Matrix topic 3), and High antibody level. It is important to mention an association between high levels of thyroid autoantibodies and the increased of mood disorders, thyroid autoimmunity disease, celiac disease, panic disorder and major depressive disorder 8.
Recomendations
Healthy diets, exercising, selenium supplementation [8], healthy sun exposure at an adequate time, getting enough sleep is primordial for the human body, in special for the metabolism regulation and the creation of normal hormones that the human body needs, 8 lowering stress levels by physical exercise is a good idea, exercise like yoga and reiki are valuable because it also exercise you brain with meditation which is a great stress reliever.
6. Benchmark
We used benchmark to perform the process time to get topics frequency in parallel using google colab with run type: GPU and TPU. We can observe that TPU machines take less time to classify topic 1. Tensor Processor Unit (TPU) is designed to run cutting-edge machine learning models with AI services on Google Cloud 21
Benchmark Topics Frequency:
| parallel Topic | Status | Time | processor |
|---|---|---|---|
| 164 1_cancer_follicular_carcinoma_autoimmune | ok | 0.53 | GPU |
| 190 1_cancer_follicular_carcinoma_autoimmune | ok | 0.002 | TPU |
7. Conclusion
As expected, we were able to derive helpful information of the Hashimoto thyroiditis disorder. we attempted to summarize our findings concerning Hashimoto thyroiditis in aspects of causes, symptoms, recommended diets and supplements and used medication.
Our findings highlight the great potential of the model we used. certainly, topic modeling method was a precise idea for the optimization of the research process. We also used various features of genism, which allows to manipulate data texts on NPL projects. The use of clustering technics was very useful to label our findings on the large datasets. Each used graph provided useful details and key words that later help us to review each important topic in a faster manner and develop the research project with accurate results.
8. Acknowledgments
Gregor von Laszewski
Yohn J Parra
Carlos Theran
9. References
-
BERT: Pre-training of Deep Bidirectional Transformers for Language Understanding, [Online resource] https://arxiv.org/abs/1810.04805 ↩︎
-
Helicobacter pylori infection in women with Hashimoto thyroiditis, [Online resource] https://www.ncbi.nlm.nih.gov/pmc/articles/PMC5265752/ ↩︎
-
I. Voloshyna, V.I Krivenko, V.G Deynega, M.A Voloshyn, Autoimmune thyrod disease related to helicobacterer pylori contamination, [Online resource] https://www.endocrine-abstracts.org/ea/0041/eposters/ea0041gp213_eposter.pdf ↩︎
-
How your diet can trigger Hashimoto’s, [Online resource] https://www.boostthyroid.com/blog/2019/4/5/how-your-diet-can-trigger-hashimotos ↩︎
-
Hypothyroidism in Context: Where We’ve Been and Where We’re Going, [Online resource] https://www.ncbi.nlm.nih.gov/pmc/articles/PMC6822815/ ↩︎
-
BERT Explained: State of the art language model for NLP https://towardsdatascience.com/bert-explained-state-of-the-art-language-model-for-nlp-f8b21a9b6270 ↩︎
-
Pavan Sanagapati, Knowledge Graph & NLP Tutorial-(BERT,spaCy,NLTK), [Online resource] https://www.kaggle.com/pavansanagapati/knowledge-graph-nlp-tutorial-bert-spacy-nltk ↩︎
-
Hashimoto’s Thyroiditis, A Common Disorder in Women: How to Treat It, [Online resource] https://www.townsendletter.com/article/441-hashimotos-thyroiditis-common-disorder-in-women/ ↩︎
-
Silobreaker: Intelligent platform for the data era https://www.silobreaker.com ↩︎
-
Gensim Tutorial – A Complete Beginners Guide, [Onile resource] https://www.machinelearningplus.com/nlp/gensim-tutorial/ ↩︎
-
Julia Haskins, Thyroid Conditions Raise the Risk of Pregnancy Complications, [Online resource] https://www.healthline.com/health-news/children-thyroid-conditions-raise-pregnancy-risks-052913 ↩︎
-
How your diet can trigger Hashimoto’s, [Online resource] https://www.boostthyroid.com/blog/2019/4/5/how-your-diet-can-trigger-hashimotos ↩︎
-
Selenium Supplementation for Hashimoto’s Thyroiditis, [Online resource] https://www.ncbi.nlm.nih.gov/pmc/articles/PMC4005265/ ↩︎
-
Thyroid Cancer Treatment, [Online resource] https://www.cancer.gov/types/thyroid/patient/thyroid-treatment-pdq ↩︎
-
Hashimoto’s Disease And Coronavirus (COVID-19), [Online resource] https://www.palomahealth.com/learn/coronavirus-and-hashimotos-disease ↩︎
-
How zebrafish research has helped in understanding thyroid diseases, [Online resource] https://www.ncbi.nlm.nih.gov/pmc/articles/PMC5730863/ ↩︎
-
Teprotumumab for the Treatment of Active Thyroid Eye Disease, [Online resource] https://www.nejm.org/doi/full/10.1056/nejmoa1910434 ↩︎
-
11 environmental triggers of Hashimoto’s, [Online research] https://www.boostthyroid.com/blog/11-environmental-triggers-of-hashimotos ↩︎
-
Hashimoto’s low thyroid autoimmune, [Online research] https://www.redriverhealthandwellness.com/diet-hashimotos-hypothyroidism/ ↩︎
-
Hashimoto’s disease, [Online research] https://www.mayoclinic.org/diseases-conditions/hashimotos-disease/symptoms-causes/syc-20351855 ↩︎
-
TPU: Tensor Processor Unit https://cloud.google.com/tpu ↩︎