Sentiment Analysis and Visualization using a US-election dataset for the 2020 Election
17 minute read
![]()
![]() Status: final, Type: Project
Status: final, Type: Project
Sudheer Alluri, Indiana University, fa20-523-316, ngsudheer@gmail.com
Vishwanadham Mandala, Indiana University, fa20-523-325, vishwandh.mandala@gmail.com
Abstract
Sentiment analysis is an evaluation of the opinion of the speaker, writer, or other subjects about some topic. We are going to use the US-elections dataset and combining the tweets of people’s opinions for leading presidential candidates. We have various datasets from Kaggle and combining tweets and NY times datasets, by combining all data prediction will be derived.
Contents
Keywords: sentiment, US-election
1. Introduction
For our final project, we are focusing on the upcoming U.S. presidential elections. More specifically, we are attempting to predict the winner of the 2020’s U.S. elections. As many people across the world know, the United States Presidential election is a very grand and important political event for the people and government of the United States of America. Not only that, the results of this election will impact the world as a whole. This year, there were many candidates. However, the election boiled down to the Democrat candidate, Joe Biden, fighting against the current Republican President of the United States of America, Donald J. Trump. There are many problems that we can run into while predicting the winner. We run into problems like finding an unbiased source or handling the size of the data. However, we believe that we found a pathway that solves all problems and effectively predicts the results of this year’s presidential election. We plan to use a US-elections dataset to predict the votes each contestant will attain, by area. With growing data, the prediction will be changing constantly. We are making the difference by selecting the latest dataset available and previous election data to predict the number of votes each contestant will get to the closest figure. A feature we are introducing to enhance the quality is predicting various area types like counties, towns, and/or big cities. One might argue that these kinds of predictions will only be helping organizations and not individuals. We assure you that this project will be helping the general public in many ways. The most evident being, an individual knowing which contestant his/her community or the general public around him/her prefer. This project is strictly statistical and does not have a goal to sway the elections in any way or to pressure an individual into picking a candidate. Overall, this is just a small step towards a future that might hold an environment where the next president of the United States of America could be accurately guessed based on previous data and innovative Big Data Technologies.
2. Background Research and Previous Work
After reading wiki/Sentiment_analysis came with a concrete idea of sentimental analysis and choose the election topic since it is the latest ongoing trend in the USA and the dataset can be easily refreshed. Social media use is at an all-time historic high for the United States, so we considered one popular social media platform, Twitter, and tried to see if we could predict how a group of people felt about an issue by only using posts from social media. For our research, we looked at tweets that focused on the 2020United States presidential election. Using these tweets, we tried to find a correlation between tweet sentiment and the election results. We wrote a program to collect tweets that mentioned one of the two candidates along with selected vice presidents, then sorted the tweets by state and developed a sentiment algorithm to see which candidate the tweet favored, or if it was neutral.
3. DataSets
By using the dataset 1 and filets are based on location. If needed, we may download Twitter data from posts on and by Donald Trump, Joe Biden, and their associates. Which leads us to our objective for the project, based on the data we collected, we should be able to predict the winner of the 2020 United States of America’s presidential elections.
All of the data will be location-based and if required we will download real-time campaigning and debate analysis data, giving us a live and updated prediction every time increment. To strengthen the prediction, even more, we may reuse some code from the 2016 election’s analysis, however, our main focus will be using the latest data we readily acquire during the time leading up to the 2020 election. In conclusion, to make our predictions as realistic and as strong as we can get, selected multiple data sets to integrate between the previous election and Twitter data to predict the number of votes each candidate will acquire. Therefore, we are predicting the winner of the 2020 presidential elections. One thing we are going to avoiding is the use of polls as source material. Many problems will arise with the use of polls. The benefits are questionable and outweighed. For one thing, the result of a poll is not concrete. One can just select a random candidate or purposely vote a candidate for an unjustified reason. One of the bigger problems is impartiality. The problem arises with the concept of an internet website, where most if not all polls are being conducted. The internet is designed so people with common interests end up at the same website. Therefore, if a poll conducting website has an audience of voters that favor one of the candidates, the results will be biased, impartial, and won’t represent the true feelings of the public. There are also thousands of these polls. Even if there are non-biased polls, one may not be able to identify them and interpret them before the end of the elections. Even if we assume that there are more unbiased polls, the sheer number will be impossible to use, and losing any might decrease the number of unbiased and raise the number of biased polls. The results of some polls are even meaningless. This can occur due to small voting numbers. If only 15 people vote, the results will not represent the mass public. The fact is that it is very hard for polls to attract voters. Without a poll achieving all these requirements and more, it will not be considered legitimate or be taken seriously. Even the actual elections require mass advertisement for people to show up. During October of an election year, there are thousands of advertisements and endorsements with the sole purpose of acquiring voters. Now the elections have government funding for these ads. Polls do not have the time or funding to attract these masses to vote. They have to suffice with the number and demographics of their voters. Which is the biggest reason why most polls are useless. Even mega corporations that conduct polls fall to more than one of these mistakes. Rendering them nugatory.
4. Methodology/Process
There are more than approximately 80 million active users of Twitter in the United States of America and Twitter makes an ideal case study of social media usage in political discourse. Our project has two main sections of data sets in it. The primary section contains candidate information and previous presidential election data, and the second containing twitter data. We believed the second needed more time because the first dataset contained straightforward facts while the twitter dataset is more susceptible to different perspectives and viewpoints. In this project, we are analyzing Twitter data of key presidential candidates and other key supporters. We gathered the data from Kaggle datasets. Data is mainly divided into 3 subcategories. Tweets made by key personnel.Twitter profiles of the two candidates(all info including followers, following, number of tweets, etc.).The final category involves graphs for visualization purposes. A problem with Twitter data is the fact that it is huge. We are using google drive and with it comes the problem of storage. To combat this we are only using 4 twitter data sets. The datasets of Donald J. Trump, Joe Biden, Kamala Harris, and Mike Pence. We also downloaded these data sets to use them locally. There are mainly 3 types of formats used in everyday twitter use: images, text, and video. Only text will be used in this project because others are not useful for the experiment. Our project mostly uses Twitter data as support to the primary dataset. It is there to strengthen the already predicted result. The reason why we cannot make the twitter data set our primary data set is that the data(tweets) are mostly opinion based with only some exceptions. So we cannot predict with the Twitter data, however, it can be used to show public support which will be vital in supporting the prediction derived from the primary data set. So, we found many twitter data sets on Kaggle and used certain parts from each to make our final four. The difference between the background sets and our final four datasets is the fact that they used Twitter data as their primary dataset while we are using Twitter data as our secondary dataset. We realized that twitter data is best used as secondary data that supports the primary dataset, which is more fact-based. We can use three of the four OSoMe tools available: trends, networking, and maps. Trends and networking can be combined to find a group that involves every user that is taking part in the elections in some way. Mapping can show these users and their location. Giving us the area based result that we seek. However, this method is already a part of our project. Because all this data is in Kaggle in a wider array. Which gave us the option to condense into four large data sets.
Our methodology comprised of following steps:
- Use of search terms “Trump”, “Pence”, “Biden”, “Kamala”, “Gender”, “Words” and “Election2020” to gather Twitter data for our period of interest.
- Data Cleaning and extraction.
- Sentiment tagging and classification of gathered tweets.
- Development of user behavioral model, formulate hypotheses, and find proof of hypotheses.
Used Python to load Twitter data which is gathered from Kaggle, used Pandas library for data cleaning and extraction of each tweet’s associated metadata. Seaborn library has been used for data visualization.
5. Development of Models
Our approach to finding the information of candidates and get the age, tweets information, and what are the keywords used and what words are liked more. Based on liked tweets and buzz words used, we are predicting the winner.
Candidates information collected are: Age of Democratic primaries candidates For some candidates it is very important to mention Women, but not for all. Added Country for reference. Where are the Democratic Candidates coming from Twitter Engagement, likes and retweets Buzzwords for each candidate By using Pandas: Used to extract the data and clean the tweets. Seaborn and Matlab, used to represent the status of elections in the graphs.
5.1 Removing Noise from Data
To increase accuracy of our analysis, the next step is to remove noise from our dataset. Presence of spam on Twitter is a well known phenomenon. Although Twitter tries hard to idntify and remove automated accounts, not everything are easily identifiable. In order to identify and remove spam present in our dataset, we removed tweets belonigng to accounts having abnormally high tweet rates. We have also filted our dataset by replaced the existing words with keywords and assigned the tweet id.
6. Technologies used
In this project Python 3 and Google Colab Jupyter Notebook were used to build the notebook. Also several Python packages were employed in this exploration such as Pandas, Numpy, Matplotlib, sklearn, wget.
7. Analysis Of User Behavior
Data is sanitized as metnioned in [^5.1], we then proceed in data mining and analysis techniques to perform data analytics and find useful information. We tried to find evidence supporting some of our beliefs that by reviewing Twitter data for insights into user behavior and tweeting patterns.
Hypothesis 1: Twitter users are commenting on the elections and retweeting the Presidential tweets.
Activity-based on following and usage: Research has been conducted on message framing behavior of users on Twitter as a function of various characteristics including the number of followers and level of activity. Adding hashtag(#) to the preceding keywords allowing users to search with the word. The use of hashtag become part of Twitter trends and also enables them to reach a large audience.
Similarly, we believe that a similar trend will be discovered in our election dataset. Users with a large following and heavy usage will be more concerned about making their tweets searchable and then those having fewer followers and less number of tweets. By framing the keyword with hashtag(#), large users are able to reach a broader audience.
Hypothesis 2: Users in the context of elections do not use Twitter only to voice their opinions but also use the platform to interact with other users on political issues.
A single tweet will be retweeted by multiple users and it reaches to a larger audience. Twitter became a platform for addressing a person directly. Direct messaging also creates complexities for users in having to handle multiplicity and one-to-one conversations at the same time.
Based on the above discussion, we assume similar behavior amongst the users of our dataset and believe that there will be a high number of one-to-one messaging indicating interactive political dialogue.
Hypothesis 3: Popular terms in Twitter discussion are significant real-world events and plays major role in elections.
Several studies have been conducted to conclude Twitter is used as a real-time latest news identification tool and studies have claimed that based on trending topics active period of tweets showed that as many as 85% of topics are headlines or persistent in real-world news.
Analysis of daily tweets during the US- election 2020 provides us current news events taking place in the real world. We analyzed high-frequency terms to justify our hypothesis.
8. Results
In this section, we present the results of the data analysis performed throughout the study. With the help of some prefatory findings, we understood the sentiment of the data, found the numerical statistics of the positive and negative tweets, and set a trend that successfully predicted the results of the 2020 U.S. presidential elections. Through the help of profound data analysis, we validated our hypotheses presented in the previous section.
The initial step of the analysis involves analyzing the data in two methods: individual candidate analysis and combined candidate analysis. Both the methods involved assigning tweets with individual sentiment scores and averaging these scores accordingly. Performing these steps, we will achieve positive and negative sentimental scores towards the candidates and get to compare these scores with each other. This way, we see an overall opinion about the candidates. We also get to monitor the conversations taking place over the topic of the election. The attitude towards the candidates is strongly positive from their inner circles. When it came to the general public, however, both candidates received negative feedback.
The mentality of the whole public can never be properly depicted by a single dataset. Furthermore, you cannot assume that the data recorded and analyzed from Twitter will be genuine in all regions. However, it can be a good representation due to its ability to empower users by allowing them to freely share their views and opinions. The consensus of an average American citizen is currently divided due to two factors. The first factor is the existence of a previous or a new affiliation with a specific political party. This is not surprising since political affiliation is a phenomenon that has existed since the conception of a democratic government. However, it does make a huge difference. Since the start of the concept, the American population has always changed their opinion. More recently, however, the general American population has dedicated its supporting two main political parties: the Democratic party and the Republican party. The population is almost split evenly throughout the country. However, the location of these specific groups has changed in recent years. The change is very interesting as it shows major trends towards the individual parties and their followers. Democratic followers, shown by twitter information of Biden supporters, tend to live in cities and are generally younger or work white-collar jobs. Republican followers, shown by twitter information of Trump supporters, tend to live in suburbs, small towns, and in the countryside. They are also generally older and have blue-collar jobs. Due to this reason, there are fewer republicans active on Twitter, however, we know that there are many more republicans outside of Twitter from the results of the previous elections. This would make our use of Twitter data nugatory. If that is the truth, why have we decided to use the Twitter data? There are indeed more Democratic Twitter users than Republican ones, however, there are many more neutral citizens that are not affiliated with any party. The second factor affects this group of neutral citizens. The second factor is the individual opinion of the person in question. The general view held in the minds of these neutral citizens, showed by many tweets from these groups of people, is that they have to choose the best option from two subpar choices. The truth of the fact is that the candidates are strongly advertising to their party supporters first and then to the supporters of the other parties and non-affiliates to any party. This leads to the neutral group not preferring the two candidates as their first choices. However, they have to choose one of the two and the decision, like all other decisions, will be heavily based on their livelihoods. Therefore, the results, based solely on Twitter data and previous presidential elections data that we have looked at, will depend on the lively hood of these neutral citizens. This will not be the perfect representation of the entire country by any means, however, the sample size is wide and large enough to be a good representation of the American public.
After all the data was collected, we have formatted the candidate’s information and cleaned the Twitter data. After closely watching the Twitter data with the graphical representation, we predicted the results. The analysis’ prediction favored Joe Biden to win this year’s election. However, President Trump was close behind. The predicted race included a very tight race, ending with Joe Biden breaking through. The actual presidential race this November seemed to be following the predicted trend, with Joe Biden taking a lead at the start and President Trump catching up by the first day’s end. The race continued to be tight for a couple of days, matching the general trend of the prediction. However, on November 7th, Biden broke through the stalemate and secured the elections. The prediction was close for most of the race, but the trend broke when Joe Biden won by a convincing lead.
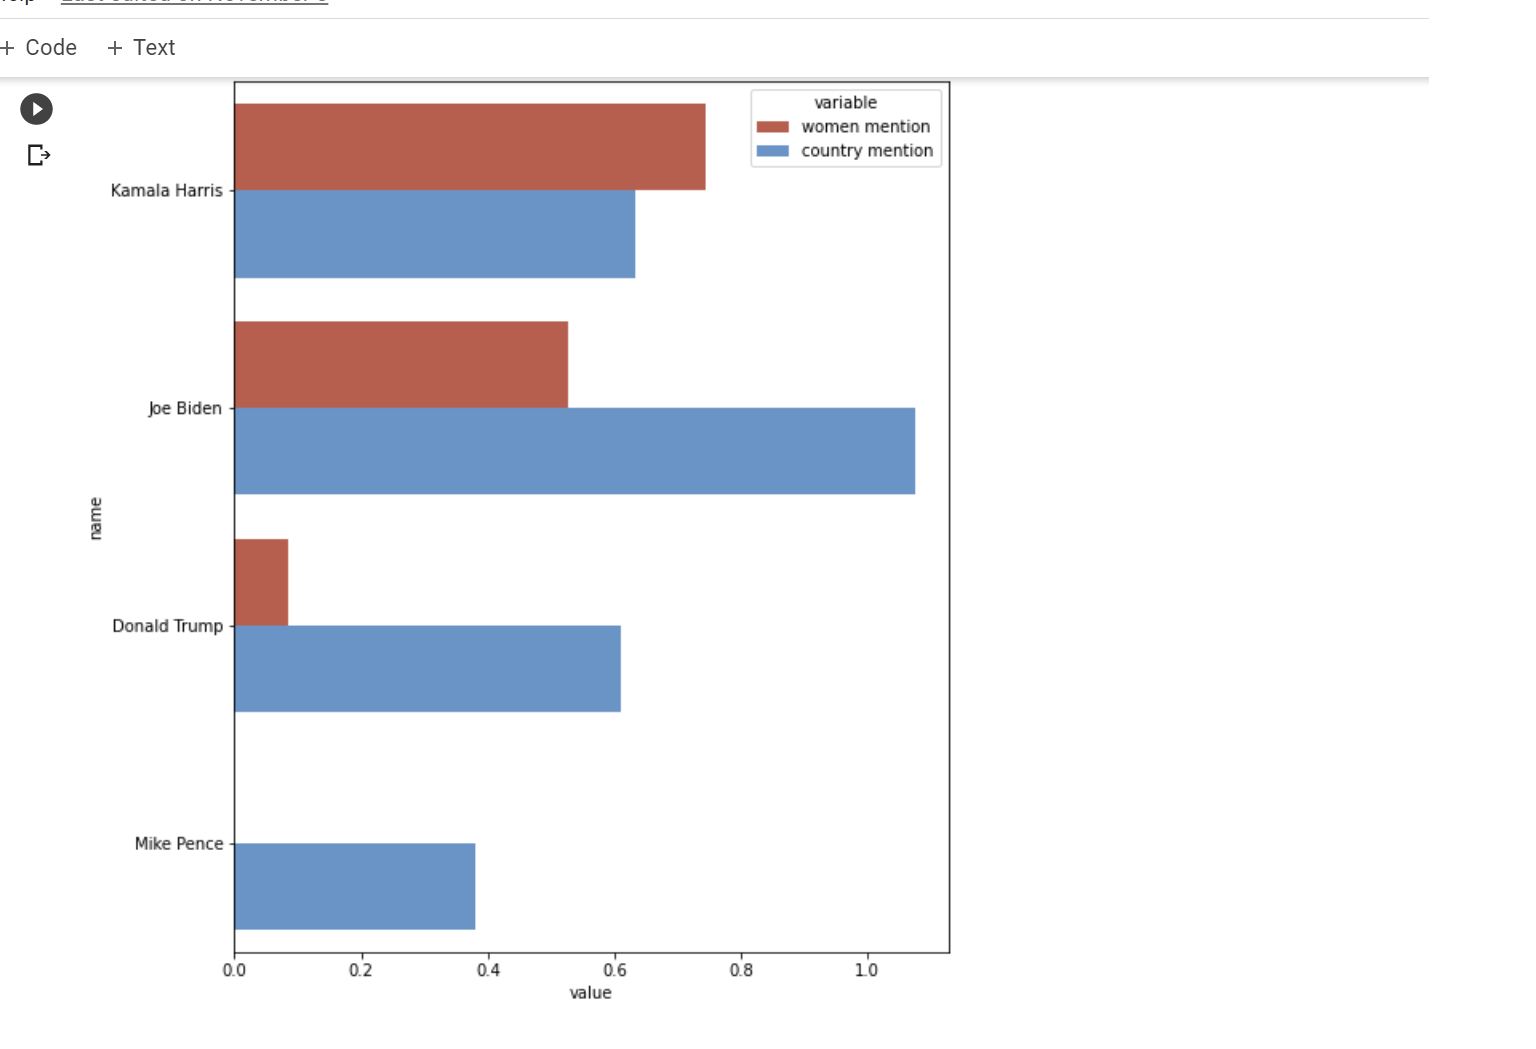
Figure 1: Predicted results of US Elections 2020
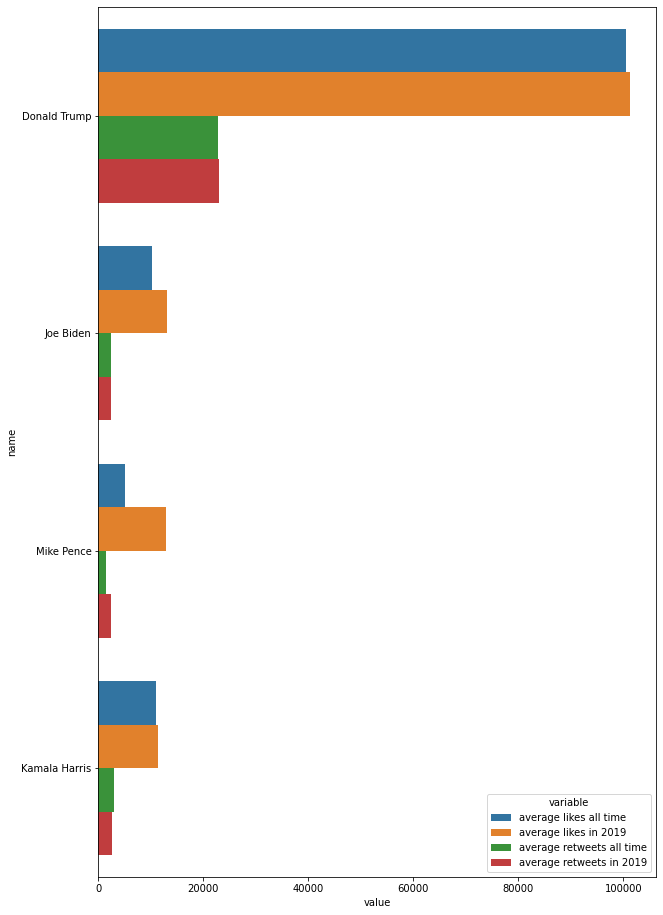
Figure 2: Liked Tweets of US Elections 2020
Reference image: https://www.kaggle.com/radustoicescu/2020-united-states-presidential-election/notebooks and edited it from our program.
Below is the example of extracting tweets and forming them into a graph to represent the data.
Among the most frequent words in tweets dedicated to Donald Trump (excluding candidates' proper nouns) occur both popular election words: “vote”, “election”, “president”, “people”, “Election Day”, etc., and specific, like “MAGA” (Trump’s tagline “Make America Great Again”) or “die” (a word with negative sense). Specific words of tweets dedicated to Joe Biden: “Kamala Harris” (Vice President-elect of the United States), “BidenHarris”, “win” (a word that is more frequent regarding Joe Biden than Donald Trump). Let’s look at Bi and Tri n-grams of words.
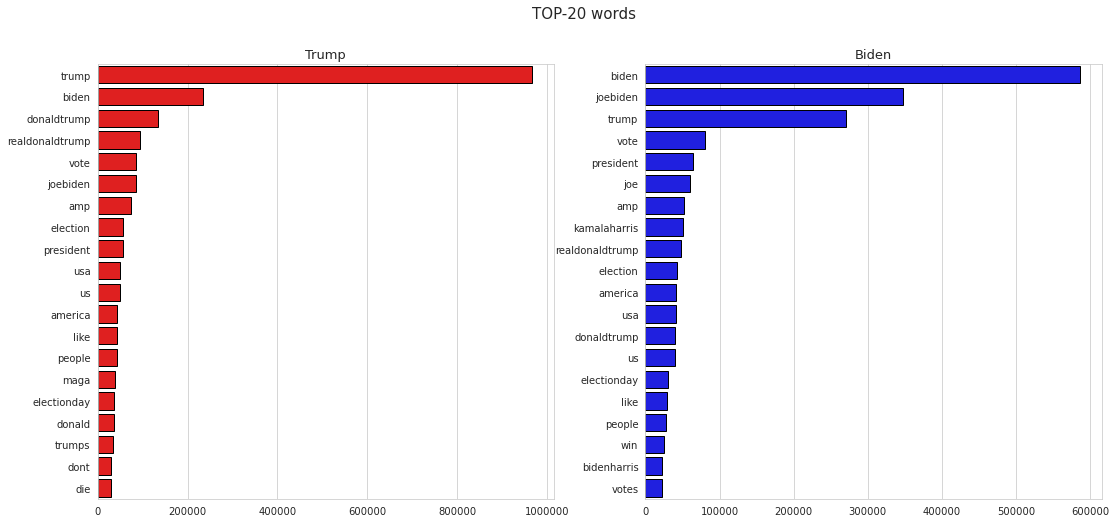
Figure 4: Retweeted of US Elections 2020 With Trump
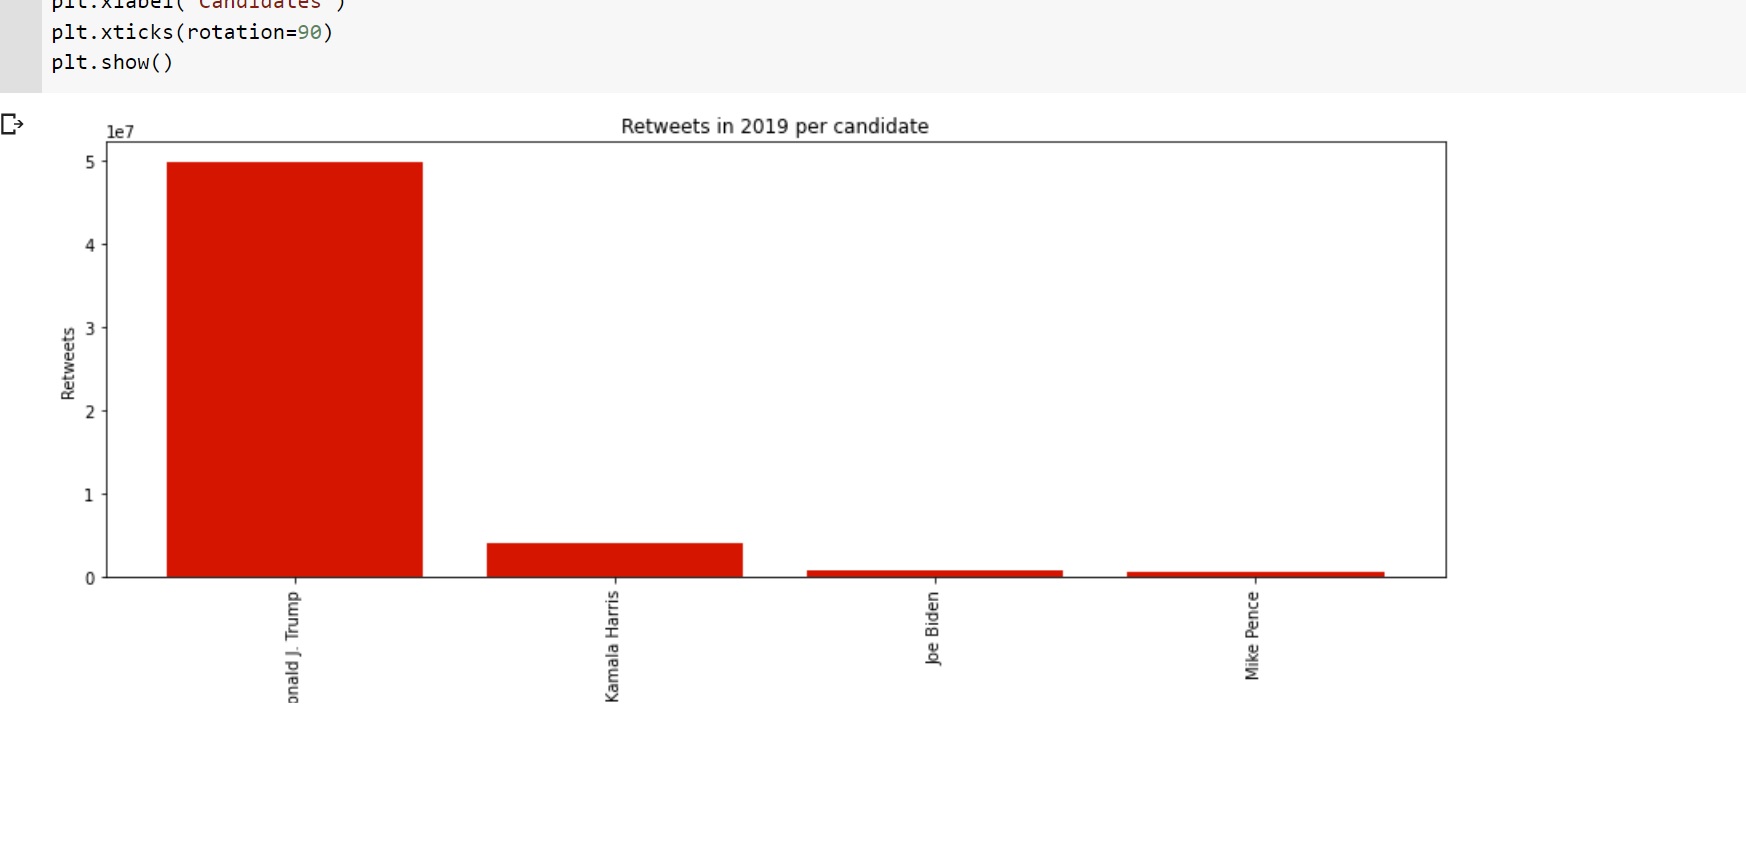
Reference image: https://www.kaggle.com/radustoicescu/2020-united-states-presidential-election/notebooks and edited it form our program.
Figure 5: Retweeted of US Elections 2020 Without Trump
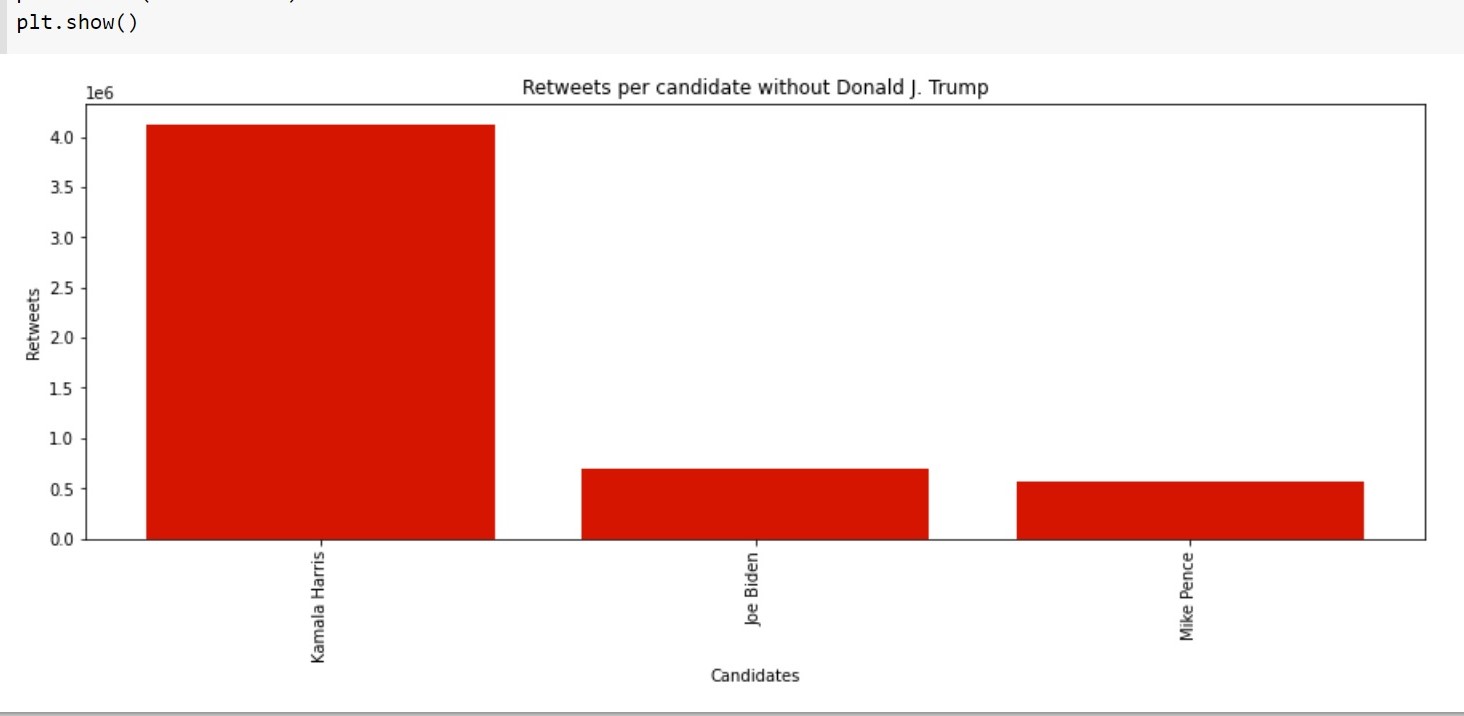
Reference image: https://www.kaggle.com/radustoicescu/2020-united-states-presidential-election/notebooks and edited it from our program.
9. Conclusion
So, we’ve taken a quick look at the sentiment of tweets. There are a lot of analysis variants. It looks great to study the tweets by each Twitter account and therefore don’t cover the actual situation since restriction to data. Based on the visualization analysis with predicted tweets from Twitter the predicted winner is projected. The sentiment analysis was performed only on data that had geo-data originating from the “United States of America” to try to ascertain the sentiment in each respective dataset and therefore each presidential candidate.
10. Acknowledgments
Would like to thank Dr. Gregor von Laszewski, Dr. Geoffrey Fox, and the associate instructors for providing continuous guidance and feedback for this final project.
11. References
-
Taken election dataset https://www.kaggle.com/kerneler/starter-2020-united-states-e6a4facf-a ↩︎